Reebok 2015 Annual Report Download - page 176
Download and view the complete annual report
Please find page 176 of the 2015 Reebok annual report below. You can navigate through the pages in the report by either clicking on the pages listed below, or by using the keyword search tool below to find specific information within the annual report.-
 1
1 -
2
-
3
-
4
-
5
-
6
-
7
-
8
-
9
-
10
-
11
-
12
-
13
-
14
-
15
-
16
-
17
-
18
-
19
-
20
-
21
-
22
-
23
-
24
-
25
-
26
-
27
-
28
-
29
-
30
-
31
-
32
-
33
-
34
-
35
-
36
-
37
-
38
-
39
-
40
-
41
-
42
-
43
-
44
-
45
-
46
-
47
-
48
-
49
-
50
-
51
-
52
-
53
-
54
-
55
-
56
-
57
-
58
-
59
-
60
-
61
-
62
-
63
-
64
-
65
-
66
-
67
-
68
-
69
-
70
-
71
-
72
-
73
-
74
-
75
-
76
-
77
-
78
-
79
-
80
-
81
-
82
-
83
-
84
-
85
-
86
-
87
-
88
-
89
-
90
-
91
-
92
-
93
-
94
-
95
-
96
-
97
-
98
-
99
-
100
-
101
-
102
-
103
-
104
-
105
-
106
-
107
-
108
-
109
-
110
-
111
-
112
-
113
-
114
-
115
-
116
-
117
-
118
-
119
-
120
-
121
-
122
-
123
-
124
-
125
-
126
-
127
-
128
-
129
-
130
-
131
-
132
-
133
-
134
-
135
-
136
-
137
-
138
-
139
-
140
-
141
-
142
-
143
-
144
-
145
-
146
-
147
-
148
-
149
-
150
-
151
-
152
-
153
-
154
-
155
-
156
-
157
-
158
-
159
-
160
-
161
-
162
-
163
-
164
-
165
-
 166
166 -
 167
167 -
 168
168 -
 169
169 -
 170
170 -
 171
171 -
 172
172 -
 173
173 -
 174
174 -
 175
175 -
 176
176 -
 177
177 -
 178
178 -
 179
179 -
 180
180 -
 181
181 -
 182
182 -
 183
183 -
 184
184 -
 185
185 -
 186
186 -
187
-
188
-
189
-
190
-
191
-
192
-
193
-
194
-
195
-
196
-
197
-
198
-
199
-
200
-
201
-
202
-
203
-
204
-
205
-
206
-
207
-
208
-
209
-
210
-
211
-
212
-
213
-
214
-
215
-
216
-
217
-
218
-
219
-
220
-
221
-
222
-
223
-
224
-
225
-
226
-
227
-
228
-
229
-
230
-
231
-
232
-
233
-
234
-
235
-
236
-
237
-
238
-
239
-
240
-
241
-
242
-
243
-
244
-
245
-
246
-
247
-
248
-
249
-
250
-
251
-
252
-
253
-
254
-
255
-
256
-
257
-
258
-
259
-
260
-
261
-
262
-
263
-
264
-
265
-
266
-
267
-
268
-
269
-
270
 |
 |
172
3
GROUP MANAGEMENT REPORT – FINANCIAL REVIEW
Risk and Opportunity Report – Illustration of Material Risks
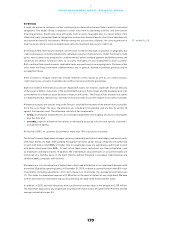
The interest rate sensitivity analysis assumes a parallel shift of the interest yield curve for all currencies and
was performed on the same basis for both 2014 and 2015. As in the prior year, a 100 basis point increase
or decrease in interest rates at December 31, 2015 would have had no major impact on shareholders’
equity and net income.
To reduce interest rate risks and maintain financial flexibility, a core tenet of our Group’s financial strategy
is to continue to use surplus cash flow from operations to reduce gross borrowings. Beyond that, the adidas
Group is constantly looking for adequate hedging strategies through interest rate derivatives in order to
mitigate interest rate risks.
In 2015, interest rates in Europe and North America remained at low levels. Given the central banks’
current interest rate policies and macroeconomic uncertainty, we do not foresee any major interest rate
increases in Europe in 2016. Due to the positive macroeconomic development in the USA, however, we
believe a slight increase in US interest rates is likely. At December 31, 2015, 80% of the Group’s financing
was denominated in euros.
Financing and liquidity risks
Liquidity risks arise from not having the necessary resources available to meet maturing liabilities with
regard to timing, volume and currency structure. In addition, the adidas Group faces the risk of having
to accept unfavourable financing terms due to liquidity restraints. Our Group Treasury department uses
an efficient cash management system to manage liquidity risk. At December 31, 2015, Group cash and
cash equivalents together with marketable securities amounted to € 1.370 billion (2014: € 1.688 billion).
Moreover, our Group maintains € 2.134 billion bilateral credit lines. In 2015, the syndicated loan facility
of € 500 million was terminated and replaced by € 700 million in committed bilateral credit lines. The
€ 2.134 billion in credit lines are designed to ensure sufficient liquidity at all times.
see Treasury, p. 124
see Treasury, p. 124
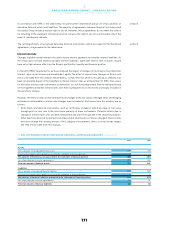
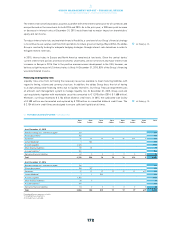
07FUTURE CASH OUTFLOWS€ IN MILLIONS
Up to
1 year
Up to
2 years
Up to
3 years
Up to
4 years
Up to
5 years
Up to
6 years
Up to
7 years
Total
As at December 31, 2015
Bank borrowings incl. commercial paper 229 229
Private placements 1142 142
Eurobond 116 16 16 16 16 616 9 705
Convertible bond 11 502 503
Accounts payable 2,024 2,024
Other financial liabilities 58 18 76
Accrued liabilities 2596 596
Derivative financial liabilities 60 0 0 0 0 0 0 60
Total 3,126 536 16 16 16 616 94,335
As at December 31, 2014
Bank borrowings incl. commercial paper 194 194
Private placements 1108 127 235
Eurobond 117 17 17 17 17 17 617 719
Convertible bond 11 1 502 504
Accounts payable 1,652 1,652
Other financial liabilities 38 7 44
Accrued liabilities 2491 491
Derivative financial liabilities 53 0 0 0 0 0 0 55
Total 2,554 152 519 17 17 17 617 3,894
Rounding difference may arise in totals.
1 Including interest payments.
2 Accrued interest excluded.