Reebok 2015 Annual Report Download - page 179
Download and view the complete annual report
Please find page 179 of the 2015 Reebok annual report below. You can navigate through the pages in the report by either clicking on the pages listed below, or by using the keyword search tool below to find specific information within the annual report.-
 1
1 -
2
-
3
-
4
-
5
-
6
-
7
-
8
-
9
-
10
-
11
-
12
-
13
-
14
-
15
-
16
-
17
-
18
-
19
-
20
-
21
-
22
-
23
-
24
-
25
-
26
-
27
-
28
-
29
-
30
-
31
-
32
-
33
-
34
-
35
-
36
-
37
-
38
-
39
-
40
-
41
-
42
-
43
-
44
-
45
-
46
-
47
-
48
-
49
-
50
-
51
-
52
-
53
-
54
-
55
-
56
-
57
-
58
-
59
-
60
-
61
-
62
-
63
-
64
-
65
-
66
-
67
-
68
-
69
-
70
-
71
-
72
-
73
-
74
-
75
-
76
-
77
-
78
-
79
-
80
-
81
-
82
-
83
-
84
-
85
-
86
-
87
-
88
-
89
-
90
-
91
-
92
-
93
-
94
-
95
-
96
-
97
-
98
-
99
-
100
-
101
-
102
-
103
-
104
-
105
-
106
-
107
-
108
-
109
-
110
-
111
-
112
-
113
-
114
-
115
-
116
-
117
-
118
-
119
-
120
-
121
-
122
-
123
-
124
-
125
-
126
-
127
-
128
-
129
-
130
-
131
-
132
-
133
-
134
-
135
-
136
-
137
-
138
-
139
-
140
-
141
-
142
-
143
-
144
-
145
-
146
-
147
-
148
-
149
-
150
-
151
-
152
-
153
-
154
-
155
-
156
-
157
-
158
-
159
-
160
-
161
-
162
-
163
-
164
-
165
-
166
-
167
-
168
-
 169
169 -
 170
170 -
 171
171 -
 172
172 -
 173
173 -
 174
174 -
 175
175 -
 176
176 -
 177
177 -
 178
178 -
 179
179 -
 180
180 -
 181
181 -
 182
182 -
 183
183 -
 184
184 -
 185
185 -
 186
186 -
 187
187 -
 188
188 -
 189
189 -
190
-
191
-
192
-
193
-
194
-
195
-
196
-
197
-
198
-
199
-
200
-
201
-
202
-
203
-
204
-
205
-
206
-
207
-
208
-
209
-
210
-
211
-
212
-
213
-
214
-
215
-
216
-
217
-
218
-
219
-
220
-
221
-
222
-
223
-
224
-
225
-
226
-
227
-
228
-
229
-
230
-
231
-
232
-
233
-
234
-
235
-
236
-
237
-
238
-
239
-
240
-
241
-
242
-
243
-
244
-
245
-
246
-
247
-
248
-
249
-
250
-
251
-
252
-
253
-
254
-
255
-
256
-
257
-
258
-
259
-
260
-
261
-
262
-
263
-
264
-
265
-
266
-
267
-
268
-
269
-
270
 |
 |

GROUP MANAGEMENT REPORT – FINANCIAL REVIEW
Management Assessment of Performance, Risks and Opportunities, and Outlook
175
3
MANAGEMENTASSESSMENT
OF PERFORMANCE, RISKS
AND OPPORTUNITIES, AND
OUTLOOK
ASSESSMENTOF PERFORMANCE VERSUSTARGETS
We communicate our Group’s financial targets on an annual basis. We also provide updates throughout
the year as appropriate. In 2015, the adidas Group delivered a stellar financial performance. Group sales
development was favourably impacted by rising consumer spending on sporting goods, supported by the
robust athleisure trend as well as increased health awareness and sports participation in most geographical
areas. In light of our highly attractive and innovative product launches, significant investments in consumer-
engaging and brand-building activities as well as the presentation of the Group’s new strategic business
plan ‘Creating the New’, the adidas Group enjoyed strong momentum, which accelerated during the course
of 2015. As a result, we increased our top- and bottom-line guidance for the full year 2015 in November,
compared to our initial expectations.
In 2015, Group revenues rose 10% on a currency-neutral basis, driven by strong growth at both adidas
and Reebok. Currency-neutral Group sales grew in most market segments, with double-digit growth
in Western Europe, Greater China, Latin America and MEAA. As a result, Group revenues increased
significantly above our initial guidance of a mid-single-digit currency-neutral increase. Gross margin
increased 0.6 percentage points to 48.3% and was in line with our initial expectations of 47.5% to 48.5%.
This development was driven by the positive effects from a more favourable pricing, channel and category
mix, more than offsetting negative currency effects and higher input costs. Operating margin excluding
goodwill impairment losses declined 0.1 percentage points to 6.5%, in line with our guidance of between
6.5% and 7.0%. This development was primarily due to higher other operating expenses as a percentage of
sales in connection with the planned increase in expenditure for point-of-sale and marketing investments
to strengthen brand desirability, which more than offset the increase in gross margin. Net income from
continuing operations excluding goodwill impairment losses grew 12% to € 720 million. This was above
our initial guidance of an improvement between 7% and 10%, despite the fact that the effective tax rate
for 2015 was 32.9%, and thus – mainly due to the non-recognition of deferred tax assets – well above the
initially expected level of around 29.5%.
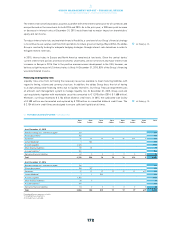
In 2015, operating working capital developed positively throughout the year. While we had initially expected
average operating working capital as a percentage of sales to decrease moderately compared to the prior
year level of 22.4%, average operating working capital as a percentage of sales improved significantly in
2015 and ended the year at 20.5%, thus exceeding our initial expectations. Capital expenditure (excluding
acquisitions) amounted to € 513 million in 2015, thus below our guidance of around € 600 million. Investments
were mainly focused on adidas and Reebok controlled space initiatives, aimed at further strengthening
the Group’s own-retail activities, franchise store presence as well as shop-in-shop presentations. Other
areas of investments included the Group’s logistic infrastructure and IT systems as well as the further
development of our Group headquarters in Herzogenaurach, Germany.
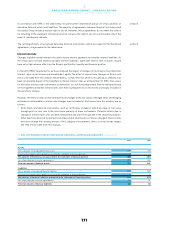
see Table 01
see Economic and Sector
Developmant, p. 107
see Income Statement, p. 111
see Statement of
Cash Flows, p. 119