Reebok 2015 Annual Report Download - page 148
Download and view the complete annual report
Please find page 148 of the 2015 Reebok annual report below. You can navigate through the pages in the report by either clicking on the pages listed below, or by using the keyword search tool below to find specific information within the annual report.-
 1
1 -
2
-
3
-
4
-
5
-
6
-
7
-
8
-
9
-
10
-
11
-
12
-
13
-
14
-
15
-
16
-
17
-
18
-
19
-
20
-
21
-
22
-
23
-
24
-
25
-
26
-
27
-
28
-
29
-
30
-
31
-
32
-
33
-
34
-
35
-
36
-
37
-
38
-
39
-
40
-
41
-
42
-
43
-
44
-
45
-
46
-
47
-
48
-
49
-
50
-
51
-
52
-
53
-
54
-
55
-
56
-
57
-
58
-
59
-
60
-
61
-
62
-
63
-
64
-
65
-
66
-
67
-
68
-
69
-
70
-
71
-
72
-
73
-
74
-
75
-
76
-
77
-
78
-
79
-
80
-
81
-
82
-
83
-
84
-
85
-
86
-
87
-
88
-
89
-
90
-
91
-
92
-
93
-
94
-
95
-
96
-
97
-
98
-
99
-
100
-
101
-
102
-
103
-
104
-
105
-
106
-
107
-
108
-
109
-
110
-
111
-
112
-
113
-
114
-
115
-
116
-
117
-
118
-
119
-
120
-
121
-
122
-
123
-
124
-
125
-
126
-
127
-
128
-
129
-
130
-
131
-
132
-
133
-
134
-
135
-
136
-
137
-
 138
138 -
 139
139 -
 140
140 -
 141
141 -
 142
142 -
 143
143 -
 144
144 -
 145
145 -
 146
146 -
 147
147 -
 148
148 -
 149
149 -
 150
150 -
 151
151 -
 152
152 -
 153
153 -
 154
154 -
 155
155 -
 156
156 -
 157
157 -
 158
158 -
159
-
160
-
161
-
162
-
163
-
164
-
165
-
166
-
167
-
168
-
169
-
170
-
171
-
172
-
173
-
174
-
175
-
176
-
177
-
178
-
179
-
180
-
181
-
182
-
183
-
184
-
185
-
186
-
187
-
188
-
189
-
190
-
191
-
192
-
193
-
194
-
195
-
196
-
197
-
198
-
199
-
200
-
201
-
202
-
203
-
204
-
205
-
206
-
207
-
208
-
209
-
210
-
211
-
212
-
213
-
214
-
215
-
216
-
217
-
218
-
219
-
220
-
221
-
222
-
223
-
224
-
225
-
226
-
227
-
228
-
229
-
230
-
231
-
232
-
233
-
234
-
235
-
236
-
237
-
238
-
239
-
240
-
241
-
242
-
243
-
244
-
245
-
246
-
247
-
248
-
249
-
250
-
251
-
252
-
253
-
254
-
255
-
256
-
257
-
258
-
259
-
260
-
261
-
262
-
263
-
264
-
265
-
266
-
267
-
268
-
269
-
270
 |
 |

144
3
GROUP MANAGEMENT REPORT – FINANCIAL REVIEW
Business Performance by Segment – Japan
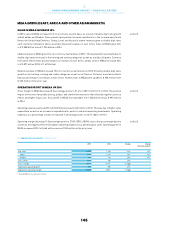
JAPAN
STABLE REVENUE DEVELOPMENT IN JAPAN
In 2015, sales in Japan remained stable on a currency-neutral basis. Currency translation effects positively
impacted revenues in euro terms. Sales in Japan grew 4% to € 776 million from € 744 million in 2014.
adidas revenues remained stable on a currency-neutral basis in Japan in 2015. Double-digit growth at
adidas Originals as well as high-single-digit increases in the running category were offset by declines in
the training and football categories, the latter being mainly due to the non-recurrence of sales related to
the 2014 FIFA World Cup. Currency translation effects had a positive impact on revenues in euro terms.
adidas sales in Japan increased 4% to € 696 million (2014: € 667 million).
Reebok revenues in Japan decreased 1% on a currency-neutral basis in 2015. Strong sales growth in the
running category, where revenues more than doubled, as well as in Classics was more than offset by sales
declines in the walking category. Currency translation effects had a positive impact on revenues in euro
terms. Reebok sales in Japan were up 3% to € 80 million from € 77 million in the prior year.
OPERATING MARGIN IN JAPAN IMPROVES 2.8 PERCENTAGE POINTS
Gross margin in Japan increased 3.7 percentage points to 47.1% in 2015 from 43.4% in 2014. The increase
was driven by a more favourable channel and pricing mix, partly offset by negative currency effects, higher
input costs as well as a less favourable product mix. Gross profit in Japan increased 13% to € 365 million
versus € 323 million in 2014.
Operating expenses were up 7% to € 231 million versus € 217 million in 2014, as a result of higher sales
expenditure as well as an increase in expenditure for point-of-sale and marketing investments. Operating
expenses as a percentage of sales increased 0.7 percentage points to 29.8% (2014: 29.1%).
Operating margin improved 2.8 percentage points to 19.0% (2014: 16.2%) as a result of the gross margin
increase, partly offset by the negative effect of higher operating expenses as a percentage of sales. Operating
profit in Japan increased 22% to € 147 million versus € 121 million in the prior year.
see Table 07
see Table 07
see Table 07
07JAPAN ATAGLANCE€ IN MILLIONS
2015 2014 Change Change
(currency-neutral)
Net sales 1776 744 4% (0%)
adidas 696 667 4% (0%)
Reebok 80 77 3% (1%)
Gross profit 365 323 13% –
Gross margin 47.1% 43.4% 3.7pp –
Segmental operating profit 147 121 22% –
Segmental operating margin 19.0% 16.2% 2.8pp –
1 Rounding differences may arise in totals.