Reebok 2015 Annual Report Download - page 149
Download and view the complete annual report
Please find page 149 of the 2015 Reebok annual report below. You can navigate through the pages in the report by either clicking on the pages listed below, or by using the keyword search tool below to find specific information within the annual report.-
 1
1 -
2
-
3
-
4
-
5
-
6
-
7
-
8
-
9
-
10
-
11
-
12
-
13
-
14
-
15
-
16
-
17
-
18
-
19
-
20
-
21
-
22
-
23
-
24
-
25
-
26
-
27
-
28
-
29
-
30
-
31
-
32
-
33
-
34
-
35
-
36
-
37
-
38
-
39
-
40
-
41
-
42
-
43
-
44
-
45
-
46
-
47
-
48
-
49
-
50
-
51
-
52
-
53
-
54
-
55
-
56
-
57
-
58
-
59
-
60
-
61
-
62
-
63
-
64
-
65
-
66
-
67
-
68
-
69
-
70
-
71
-
72
-
73
-
74
-
75
-
76
-
77
-
78
-
79
-
80
-
81
-
82
-
83
-
84
-
85
-
86
-
87
-
88
-
89
-
90
-
91
-
92
-
93
-
94
-
95
-
96
-
97
-
98
-
99
-
100
-
101
-
102
-
103
-
104
-
105
-
106
-
107
-
108
-
109
-
110
-
111
-
112
-
113
-
114
-
115
-
116
-
117
-
118
-
119
-
120
-
121
-
122
-
123
-
124
-
125
-
126
-
127
-
128
-
129
-
130
-
131
-
132
-
133
-
134
-
135
-
136
-
137
-
138
-
 139
139 -
 140
140 -
 141
141 -
 142
142 -
 143
143 -
 144
144 -
 145
145 -
 146
146 -
 147
147 -
 148
148 -
 149
149 -
 150
150 -
 151
151 -
 152
152 -
 153
153 -
 154
154 -
 155
155 -
 156
156 -
 157
157 -
 158
158 -
 159
159 -
160
-
161
-
162
-
163
-
164
-
165
-
166
-
167
-
168
-
169
-
170
-
171
-
172
-
173
-
174
-
175
-
176
-
177
-
178
-
179
-
180
-
181
-
182
-
183
-
184
-
185
-
186
-
187
-
188
-
189
-
190
-
191
-
192
-
193
-
194
-
195
-
196
-
197
-
198
-
199
-
200
-
201
-
202
-
203
-
204
-
205
-
206
-
207
-
208
-
209
-
210
-
211
-
212
-
213
-
214
-
215
-
216
-
217
-
218
-
219
-
220
-
221
-
222
-
223
-
224
-
225
-
226
-
227
-
228
-
229
-
230
-
231
-
232
-
233
-
234
-
235
-
236
-
237
-
238
-
239
-
240
-
241
-
242
-
243
-
244
-
245
-
246
-
247
-
248
-
249
-
250
-
251
-
252
-
253
-
254
-
255
-
256
-
257
-
258
-
259
-
260
-
261
-
262
-
263
-
264
-
265
-
266
-
267
-
268
-
269
-
270
 |
 |
145
3
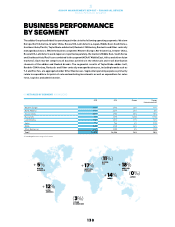
GROUP MANAGEMENT REPORT – FINANCIAL REVIEW
Business Performance by Segment – MEAA (Middle East, Africa and other Asian markets)
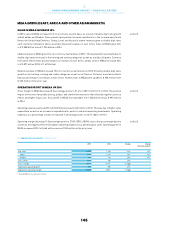
MEAA MIDDLE EAST, AFRICA AND OTHER ASIAN MARKETS
SALES IN MEAA INCREASE 14%
In 2015, sales in MEAA increased 14% on a currency-neutral basis, as a result of double-digit sales growth
at both adidas and Reebok. From a market perspective, the main contributors to the increase were South
Korea, the United Arab Emirates, Turkey, Israel and Australia, where revenues grew at double-digit rates
each. Currency translation effects positively impacted revenues in euro terms. Sales in MEAA grew 24%
to € 2.388 billion from € 1.925 billion in 2014.
adidas revenues in MEAA grew 13% on a currency-neutral basis in 2015. This development was mainly due to
double-digit sales increases in the training and running categories as well as at adidas Originals. Currency
translation effects had a positive impact on revenues in euro terms. adidas sales in MEAA increased 23%
to € 2.091 billion (2014: € 1.693 billion).
Reebok revenues in MEAA increased 15% on a currency-neutral basis in 2015, driven by double-digit sales
growth in the training, running and studio categories as well as in Classics. Currency translation effects
had a positive impact on revenues in euro terms. Reebok sales in MEAA were up 28% to € 298 million from
€ 232 million in the prior year.
OPERATING PROFIT IN MEAA UP 20%
Gross margin in MEAA decreased 0.2 percentage points to 51.4% in 2015 from 51.7% in 2014. The positive
impact from a more favourable pricing, product and channel mix was more than offset by negative currency
effects and higher input costs. Gross profit in MEAA increased 23% to € 1.228 billion versus € 995 million
in 2014.
Operating expenses were up 28% to € 565 million versus € 442 million in 2014. This was due to higher sales
expenditure as well as an increase in expenditure for point-of-sale and marketing investments. Operating
expenses as a percentage of sales increased 0.7 percentage points to 23.7% (2014: 22.9%).
Operating margin decreased 1.0 percentage points to 27.8% (2014: 28.8%), due to the gross margin decline
as well as the negative effect from higher operating expenses as a percentage of sales. Operating profit in
MEAA increased 20% to € 664 million versus € 555 million in the prior year.
see Table 08
see Table 08
see Table 08
08MEAA ATAGLANCE€ IN MILLIONS
2015 2014 Change Change
(currency-neutral)
Net sales 12,388 1,925 24% 14%
adidas 2,091 1,693 23% 13%
Reebok 298 232 28% 15%
Gross profit 1,228 995 23% –
Gross margin 51.4% 51.7% (0.2pp) –
Segmental operating profit 664 555 20% –
Segmental operating margin 27.8% 28.8% (1.0pp) –
1 Rounding differences may arise in totals.