Reebok 2015 Annual Report Download - page 130
Download and view the complete annual report
Please find page 130 of the 2015 Reebok annual report below. You can navigate through the pages in the report by either clicking on the pages listed below, or by using the keyword search tool below to find specific information within the annual report.-
 1
1 -
2
-
3
-
4
-
5
-
6
-
7
-
8
-
9
-
10
-
11
-
12
-
13
-
14
-
15
-
16
-
17
-
18
-
19
-
20
-
21
-
22
-
23
-
24
-
25
-
26
-
27
-
28
-
29
-
30
-
31
-
32
-
33
-
34
-
35
-
36
-
37
-
38
-
39
-
40
-
41
-
42
-
43
-
44
-
45
-
46
-
47
-
48
-
49
-
50
-
51
-
52
-
53
-
54
-
55
-
56
-
57
-
58
-
59
-
60
-
61
-
62
-
63
-
64
-
65
-
66
-
67
-
68
-
69
-
70
-
71
-
72
-
73
-
74
-
75
-
76
-
77
-
78
-
79
-
80
-
81
-
82
-
83
-
84
-
85
-
86
-
87
-
88
-
89
-
90
-
91
-
92
-
93
-
94
-
95
-
96
-
97
-
98
-
99
-
100
-
101
-
102
-
103
-
104
-
105
-
106
-
107
-
108
-
109
-
110
-
111
-
112
-
113
-
114
-
115
-
116
-
117
-
118
-
119
-
 120
120 -
 121
121 -
 122
122 -
 123
123 -
 124
124 -
 125
125 -
 126
126 -
 127
127 -
 128
128 -
 129
129 -
 130
130 -
 131
131 -
 132
132 -
 133
133 -
 134
134 -
 135
135 -
 136
136 -
 137
137 -
 138
138 -
 139
139 -
 140
140 -
141
-
142
-
143
-
144
-
145
-
146
-
147
-
148
-
149
-
150
-
151
-
152
-
153
-
154
-
155
-
156
-
157
-
158
-
159
-
160
-
161
-
162
-
163
-
164
-
165
-
166
-
167
-
168
-
169
-
170
-
171
-
172
-
173
-
174
-
175
-
176
-
177
-
178
-
179
-
180
-
181
-
182
-
183
-
184
-
185
-
186
-
187
-
188
-
189
-
190
-
191
-
192
-
193
-
194
-
195
-
196
-
197
-
198
-
199
-
200
-
201
-
202
-
203
-
204
-
205
-
206
-
207
-
208
-
209
-
210
-
211
-
212
-
213
-
214
-
215
-
216
-
217
-
218
-
219
-
220
-
221
-
222
-
223
-
224
-
225
-
226
-
227
-
228
-
229
-
230
-
231
-
232
-
233
-
234
-
235
-
236
-
237
-
238
-
239
-
240
-
241
-
242
-
243
-
244
-
245
-
246
-
247
-
248
-
249
-
250
-
251
-
252
-
253
-
254
-
255
-
256
-
257
-
258
-
259
-
260
-
261
-
262
-
263
-
264
-
265
-
266
-
267
-
268
-
269
-
270
 |
 |

126
3
GROUP MANAGEMENT REPORT – FINANCIAL REVIEW
Group Business Performance – Treasury
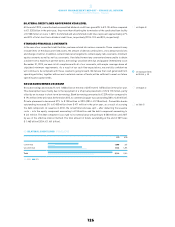
BILATERALCREDIT LINESABOVE PRIOR YEAR LEVEL
At the end of 2015, committed and uncommitted bilateral credit lines grew 40% to € 2.134 billion compared
to € 1.520 billion in the prior year, thus more than offsetting the termination of the syndicated loan facility
of € 500 million on June 1, 2015. Committed and uncommitted credit lines represent approximately 47%
and 53% of total short-term bilateral credit lines, respectively (2014: 15% and 85%, respectively).
STANDARD FINANCIALCOVENANTS
In the case of our committed credit facilities, we have entered into various covenants. These covenants may
include limits on the disposal of fixed assets, the amount of debt secured by liens, cross default provisions
and change of control. In addition, certain financial arrangements contain equity ratio covenants, minimum
equity covenants as well as net loss covenants. If we failed to meet any covenant and were unable to obtain
a waiver from a majority of partner banks, borrowings would become due and payable immediately. As at
December 31, 2015, we were in full compliance with all of our covenants, with ample coverage above all
stipulated minimum requirements. As a result of our cash flow expectations, we are fully confident we
will continue to be compliant with these covenants going forward. We believe that cash generated from
operating activities, together with access to external sources of funds, will be sufficient to meet our future
operating and capital needs.
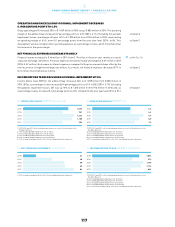
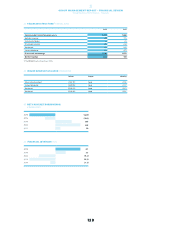
GROSS BORROWINGS DECREASE
Gross borrowings decreased 2% to € 1.830 billion at the end of 2015 from € 1.873 billion in the prior year.
This development was mainly due to the repayment of a US private placement of US $ 115 million, partly
offset by an increase in short-term borrowings. Bank borrowings amounted to € 229 million compared to
€ 194 million in the prior year. At the end of 2015, no commercial paper was outstanding (2014: € 20 million).
Private placements decreased 37% to € 138 million in 2015 (2014: € 218 million). Convertible bonds
outstanding increased 2% to € 483 million from € 471 million in the prior year, as a result of accruing
the debt component. At issuance in 2012, the convertible bond was split – after deducting the issuance
costs – into the equity component amounting to € 55 million and the debt component amounting to
€ 441 million. The debt component is accrued to its nominal value amounting to € 500 million until 2017
by use of the effective interest method. The total amount of bonds outstanding at the end of 2015 was
€ 1.463 billion (2014: € 1.461 billion).
see Diagram 40
see Subsequent Events
and Outlook, p. 148
see Diagram 42
see Table 43
40BILATERALCREDIT LINES€ IN MILLIONS
2015 2014
Committed 1,008 235
Uncommitted 1,126 1,285
Total 2,134 1,520
■
2014
■
2015