Reebok 2015 Annual Report Download - page 125
Download and view the complete annual report
Please find page 125 of the 2015 Reebok annual report below. You can navigate through the pages in the report by either clicking on the pages listed below, or by using the keyword search tool below to find specific information within the annual report.-
 1
1 -
2
-
3
-
4
-
5
-
6
-
7
-
8
-
9
-
10
-
11
-
12
-
13
-
14
-
15
-
16
-
17
-
18
-
19
-
20
-
21
-
22
-
23
-
24
-
25
-
26
-
27
-
28
-
29
-
30
-
31
-
32
-
33
-
34
-
35
-
36
-
37
-
38
-
39
-
40
-
41
-
42
-
43
-
44
-
45
-
46
-
47
-
48
-
49
-
50
-
51
-
52
-
53
-
54
-
55
-
56
-
57
-
58
-
59
-
60
-
61
-
62
-
63
-
64
-
65
-
66
-
67
-
68
-
69
-
70
-
71
-
72
-
73
-
74
-
75
-
76
-
77
-
78
-
79
-
80
-
81
-
82
-
83
-
84
-
85
-
86
-
87
-
88
-
89
-
90
-
91
-
92
-
93
-
94
-
95
-
96
-
97
-
98
-
99
-
100
-
101
-
102
-
103
-
104
-
105
-
106
-
107
-
108
-
109
-
110
-
111
-
112
-
113
-
114
-
 115
115 -
 116
116 -
 117
117 -
 118
118 -
 119
119 -
 120
120 -
 121
121 -
 122
122 -
 123
123 -
 124
124 -
 125
125 -
 126
126 -
 127
127 -
 128
128 -
 129
129 -
 130
130 -
 131
131 -
 132
132 -
 133
133 -
 134
134 -
 135
135 -
136
-
137
-
138
-
139
-
140
-
141
-
142
-
143
-
144
-
145
-
146
-
147
-
148
-
149
-
150
-
151
-
152
-
153
-
154
-
155
-
156
-
157
-
158
-
159
-
160
-
161
-
162
-
163
-
164
-
165
-
166
-
167
-
168
-
169
-
170
-
171
-
172
-
173
-
174
-
175
-
176
-
177
-
178
-
179
-
180
-
181
-
182
-
183
-
184
-
185
-
186
-
187
-
188
-
189
-
190
-
191
-
192
-
193
-
194
-
195
-
196
-
197
-
198
-
199
-
200
-
201
-
202
-
203
-
204
-
205
-
206
-
207
-
208
-
209
-
210
-
211
-
212
-
213
-
214
-
215
-
216
-
217
-
218
-
219
-
220
-
221
-
222
-
223
-
224
-
225
-
226
-
227
-
228
-
229
-
230
-
231
-
232
-
233
-
234
-
235
-
236
-
237
-
238
-
239
-
240
-
241
-
242
-
243
-
244
-
245
-
246
-
247
-
248
-
249
-
250
-
251
-
252
-
253
-
254
-
255
-
256
-
257
-
258
-
259
-
260
-
261
-
262
-
263
-
264
-
265
-
266
-
267
-
268
-
269
-
270
 |
 |

121
3
GROUP MANAGEMENT REPORT – FINANCIAL REVIEW
Group Business Performance – Statement of Financial Position and Statement of Cash Flows
LIABILITIESAND EQUITY
Total current liabilities increased 23% to € 5.364 billion at the end of December 2015 from € 4.378 billion in
2014. Accounts payable increased 23% to € 2.024 billion at the end of December 2015 versus € 1.652 billion
in 2014. On a currency-neutral basis, accounts payable grew 22%, reflecting the growth in inventories
compared to the prior year. At the end of December 2015, other current financial liabilities grew 56% to
€ 143 million from € 91 million in 2014, driven by purchase price obligations for non-controlling interests.
Short-term borrowings increased 27% to € 366 million at the end of December 2015 (2014: € 288 million).
This development was mainly due to a reclassification of private placements from long-term borrowings to
short-term borrowings. Other current provisions were down 3% to € 456 million at the end of December
2015 versus € 470 million in 2014, mainly as a result of a decrease in provisions for marketing expenditure
which was partly offset by negative currency effects of € 12 million. Current accrued liabilities grew 35%
to € 1.684 billion at the end of December 2015 from € 1.249 billion in 2014, mainly due to an increase in
accruals for customer discounts, invoices not yet received, marketing expenditure and personnel. Currency
translation effects of € 39 million also contributed to the increase in current accrued liabilities. Other
current liabilities were up 15% to € 331 million at the end of December 2015 from € 287 million in 2014,
mainly due to an increase in customers with credit balances as well as payables due to personnel.
Total non-current liabilities decreased 4% to € 2.332 billion at the end of December 2015 from € 2.422 billion
in the prior year. Long-term borrowings decreased 8% to € 1.463 billion at the end of December 2015
from € 1.584 billion in the prior year. This development was mainly due to the reclassification of private
placements from long-term borrowings to short-term borrowings. Other non-current provisions grew
30% to € 50 million at the end of December 2015 versus € 38 million in 2014. This primarily related to
an increase in other operational provisions. Non-current accrued liabilities grew 48% to € 120 million at
the end of December 2015 from € 81 million in 2014, mainly due to an increase in accruals for personnel.
Other non-current liabilities increased 17% to € 40 million at the end of December 2015 from € 35 million
in 2014. Other non-current financial liabilities more than doubled to € 18 million at the end of December
2015 from € 9 million in 2014, mainly due to the earn-out components for Runtastic.
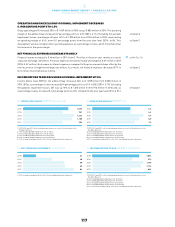
Shareholders’ equity increased 1% to € 5.666 billion at the end of December 2015 versus € 5.624 billion
in 2014. The net income generated during the last twelve months as well as positive currency translation
effects of € 134 million were partly offset by the repurchase of treasury shares in an amount of € 301 million,
the dividend of € 303 million paid to shareholders for the 2014 financial year as well as a decrease in
hedging reserves of € 117 million. The Group’s equity ratio at the end of December 2015 decreased to
42.5% compared to 45.3% in the prior year.
OPERATINGWORKING CAPITAL
Operating working capital increased 11% to € 3.138 billion at the end of December 2015 compared to
€ 2.821 billion in 2014. Average operating working capital as a percentage of sales decreased 1.9 percentage
points to 20.5% (2014: 22.4%), reflecting the strong revenue growth in 2015 as well as the company’s
continued focus on tight working capital management.
see Note 19, p. 213
see Note 21, p. 214
see Note 22, p. 215
see Diagram 31
see Note 18, p. 212
see Note 25, p. 220
see Note 26, p. 220
see Diagram 32
see Glossary, p. 260
see Diagram 33
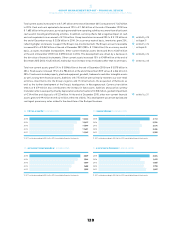
32 SHAREHOLDERS’ EQUITY 1
€ IN MILLIONS
2015 5,666
2014 5,624
2013 5,489
2012 5,304
2011 5,137
1 2011 restated according to IAS 8 in the 2012 consolidated financial statements.
33 AVERAGE OPERATINGWORKING CAPITAL 1, 2
IN % OF NETSALES
2015 20.5%
2014 22.4%
2013 21.3%
2012 20.0%
2011 20.4%
1 2015, 2014 and 2013 reflect continuing operations as a result of the divestiture of the
Rockport business.
2 2011 restated according to IAS 8 in the 2012 consolidated financial statements.