Reebok 2015 Annual Report Download - page 151
Download and view the complete annual report
Please find page 151 of the 2015 Reebok annual report below. You can navigate through the pages in the report by either clicking on the pages listed below, or by using the keyword search tool below to find specific information within the annual report.-
 1
1 -
2
-
3
-
4
-
5
-
6
-
7
-
8
-
9
-
10
-
11
-
12
-
13
-
14
-
15
-
16
-
17
-
18
-
19
-
20
-
21
-
22
-
23
-
24
-
25
-
26
-
27
-
28
-
29
-
30
-
31
-
32
-
33
-
34
-
35
-
36
-
37
-
38
-
39
-
40
-
41
-
42
-
43
-
44
-
45
-
46
-
47
-
48
-
49
-
50
-
51
-
52
-
53
-
54
-
55
-
56
-
57
-
58
-
59
-
60
-
61
-
62
-
63
-
64
-
65
-
66
-
67
-
68
-
69
-
70
-
71
-
72
-
73
-
74
-
75
-
76
-
77
-
78
-
79
-
80
-
81
-
82
-
83
-
84
-
85
-
86
-
87
-
88
-
89
-
90
-
91
-
92
-
93
-
94
-
95
-
96
-
97
-
98
-
99
-
100
-
101
-
102
-
103
-
104
-
105
-
106
-
107
-
108
-
109
-
110
-
111
-
112
-
113
-
114
-
115
-
116
-
117
-
118
-
119
-
120
-
121
-
122
-
123
-
124
-
125
-
126
-
127
-
128
-
129
-
130
-
131
-
132
-
133
-
134
-
135
-
136
-
137
-
138
-
139
-
140
-
 141
141 -
 142
142 -
 143
143 -
 144
144 -
 145
145 -
 146
146 -
 147
147 -
 148
148 -
 149
149 -
 150
150 -
 151
151 -
 152
152 -
 153
153 -
 154
154 -
 155
155 -
 156
156 -
 157
157 -
 158
158 -
 159
159 -
 160
160 -
 161
161 -
162
-
163
-
164
-
165
-
166
-
167
-
168
-
169
-
170
-
171
-
172
-
173
-
174
-
175
-
176
-
177
-
178
-
179
-
180
-
181
-
182
-
183
-
184
-
185
-
186
-
187
-
188
-
189
-
190
-
191
-
192
-
193
-
194
-
195
-
196
-
197
-
198
-
199
-
200
-
201
-
202
-
203
-
204
-
205
-
206
-
207
-
208
-
209
-
210
-
211
-
212
-
213
-
214
-
215
-
216
-
217
-
218
-
219
-
220
-
221
-
222
-
223
-
224
-
225
-
226
-
227
-
228
-
229
-
230
-
231
-
232
-
233
-
234
-
235
-
236
-
237
-
238
-
239
-
240
-
241
-
242
-
243
-
244
-
245
-
246
-
247
-
248
-
249
-
250
-
251
-
252
-
253
-
254
-
255
-
256
-
257
-
258
-
259
-
260
-
261
-
262
-
263
-
264
-
265
-
266
-
267
-
268
-
269
-
270
 |
 |
147
3
GROUP MANAGEMENT REPORT – FINANCIAL REVIEW
Business Performance by Segment – Other Businesses
GROSS MARGIN DECLINES 0.8 PERCENTAGE POINTS
Gross margin in Other Businesses decreased 0.8 percentage points to 33.9% (2014: 34.7%), due to gross
margin declines at both TaylorMade-adidas Golf and Reebok-CCM Hockey. Gross profit was up 6% to
€ 497 million in 2015 versus € 471 million in 2014.
Operating expenses increased 11% to € 596 million from € 536 million in 2014, as a result of higher sales
expenditure as well as an increase in expenditure for point-of-sale and marketing investments. Operating
expenses as a percentage of sales increased 1.2 percentage points to 40.6% (2014: 39.5%).
In 2015, Other Businesses recorded an operating loss of € 89 million (2014: operating loss of € 57 million).
This resulted in a negative operating margin of 6.1% compared to a negative operating margin of 4.2% in
2014. This development was a result of the gross margin decline as well as the negative effect of higher
operating expenses as a percentage of sales.
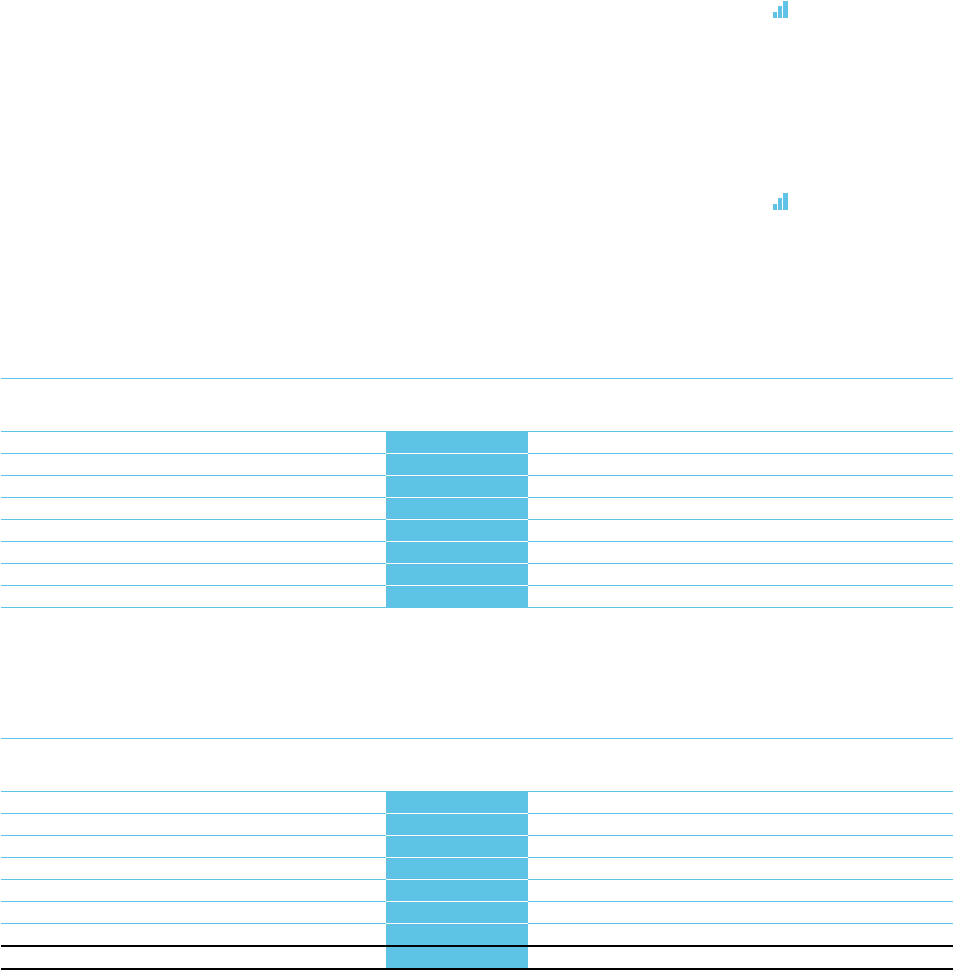
see Table 09
see Table 09
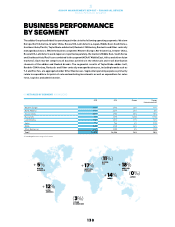
09OTHER BUSINESSESATAGLANCE€ IN MILLIONS
2015 2014 Change Change
(currency-neutral)
Net sales 11,467 1,358 8% (3%)
TaylorMade-adidas Golf 902 913 (1%) (13%)
Reebok-CCM Hockey 317 269 18% 8%
Other centrally managed businesses 242 175 38% 35%
Gross profit 497 471 6% –
Gross margin 33.9% 34.7% (0.8pp) –
Operating profit (89) (57) (56%) –
Operating margin (6.1%) (4.2%) (1.9pp) –
1 Rounding differences may arise in totals.
10OTHER BUSINESSES NETSALES BY REGION€ IN MILLIONS
2015 2014 Change Change
(currency-neutral)
Western Europe 383 315 21% 17%
North America 783 755 4% (11%)
Greater China 22 25 (12%) (25%)
Russia/CIS 3 11 (68%) (58%)
Latin America 11 10 16% 14%
Japan 156 148 6% 1%
MEAA 109 94 16% 7%
Total 11,467 1,358 8% (3%)
1 Rounding differences may arise in totals.