Reebok 2015 Annual Report Download - page 173
Download and view the complete annual report
Please find page 173 of the 2015 Reebok annual report below. You can navigate through the pages in the report by either clicking on the pages listed below, or by using the keyword search tool below to find specific information within the annual report.-
 1
1 -
2
-
3
-
4
-
5
-
6
-
7
-
8
-
9
-
10
-
11
-
12
-
13
-
14
-
15
-
16
-
17
-
18
-
19
-
20
-
21
-
22
-
23
-
24
-
25
-
26
-
27
-
28
-
29
-
30
-
31
-
32
-
33
-
34
-
35
-
36
-
37
-
38
-
39
-
40
-
41
-
42
-
43
-
44
-
45
-
46
-
47
-
48
-
49
-
50
-
51
-
52
-
53
-
54
-
55
-
56
-
57
-
58
-
59
-
60
-
61
-
62
-
63
-
64
-
65
-
66
-
67
-
68
-
69
-
70
-
71
-
72
-
73
-
74
-
75
-
76
-
77
-
78
-
79
-
80
-
81
-
82
-
83
-
84
-
85
-
86
-
87
-
88
-
89
-
90
-
91
-
92
-
93
-
94
-
95
-
96
-
97
-
98
-
99
-
100
-
101
-
102
-
103
-
104
-
105
-
106
-
107
-
108
-
109
-
110
-
111
-
112
-
113
-
114
-
115
-
116
-
117
-
118
-
119
-
120
-
121
-
122
-
123
-
124
-
125
-
126
-
127
-
128
-
129
-
130
-
131
-
132
-
133
-
134
-
135
-
136
-
137
-
138
-
139
-
140
-
141
-
142
-
143
-
144
-
145
-
146
-
147
-
148
-
149
-
150
-
151
-
152
-
153
-
154
-
155
-
156
-
157
-
158
-
159
-
160
-
161
-
162
-
 163
163 -
 164
164 -
 165
165 -
 166
166 -
 167
167 -
 168
168 -
 169
169 -
 170
170 -
 171
171 -
 172
172 -
 173
173 -
 174
174 -
 175
175 -
 176
176 -
 177
177 -
 178
178 -
 179
179 -
 180
180 -
 181
181 -
 182
182 -
 183
183 -
184
-
185
-
186
-
187
-
188
-
189
-
190
-
191
-
192
-
193
-
194
-
195
-
196
-
197
-
198
-
199
-
200
-
201
-
202
-
203
-
204
-
205
-
206
-
207
-
208
-
209
-
210
-
211
-
212
-
213
-
214
-
215
-
216
-
217
-
218
-
219
-
220
-
221
-
222
-
223
-
224
-
225
-
226
-
227
-
228
-
229
-
230
-
231
-
232
-
233
-
234
-
235
-
236
-
237
-
238
-
239
-
240
-
241
-
242
-
243
-
244
-
245
-
246
-
247
-
248
-
249
-
250
-
251
-
252
-
253
-
254
-
255
-
256
-
257
-
258
-
259
-
260
-
261
-
262
-
263
-
264
-
265
-
266
-
267
-
268
-
269
-
270
 |
 |

169
3
GROUP MANAGEMENT REPORT – FINANCIAL REVIEW
Risk and Opportunity Report – Illustration of Material Risks
Risks related to impairment of goodwill/other intangible assets
As a result of various acquisitions in the past, our balance sheet carries book values of approximately
€ 1.4 billion in goodwill and € 1.8 billion in other intangible assets (including trademarks). Deterioration
in the business performance, and particularly in future business prospects, as well as significant exchange
rate fluctuations could require corrections of these book values by incurring impairment charges. In
addition, increases in market interest rates could trigger increases in discount rates used in our impairment
test for goodwill and require impairment charges. An impairment charge would be a purely accounting,
non-cash effect impacting the Group’s operating result.
see Notes 13 and 14,
p. 207 and p. 210
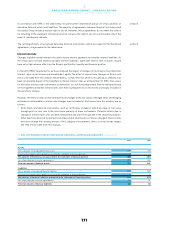
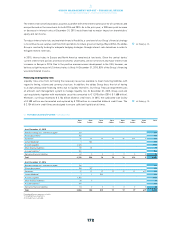
04EXPOSURE TO FOREIGN EXCHANGE RISK 1BASED ON NOTIONAL AMOUNTS , € IN MILLIONS
USD RUB GBP JPY
As at December 31, 2015
Exposure from firm commitments and forecasted transactions (5,849) 299 834 483
Balance sheet exposure including intercompany exposure (429) 10 (47) 7
Total gross exposure (6,278) 309 787 490
Hedged with other cash flows 110
Hedged with currency options (59)
Hedged with forward contracts 4,135 (47) (549) (414)
Net exposure (2,033) 262 179 76
As at December 31, 2014
Exposure from firm commitments and forecasted transactions (4,890) 318 521 372
Balance sheet exposure including intercompany exposure (393) 13 13 5
Total gross exposure (5,283) 331 534 377
Hedged with other cash flows 99
Hedged with currency options 278
Hedged with forward contracts 3,128 (14) (355) (345)
Net exposure (1,778) 317 179 32
1 Rounding difference may arise in totals.
05SENSITIVITYANALYSIS OF FOREIGN EXCHANGE RATE CHANGES€ IN MILLIONS
USD RUB GBP JPY
As at December 31, 2015
EUR +10% USD +10% EUR +10% EUR +10%
Equity (225) – 61 40
Net income 7 4 4 (1)
EUR – 10% USD – 10% EUR – 10% EUR – 10%
Equity 238 – (61) (41)
Net income (9) (4) (5) 1
As at December 31, 2014
EUR +10% USD +10% EUR +10% EUR +10%
Equity (188) – 29 27
Net income 7 4 (1) 0
EUR – 10% USD – 10% EUR – 10% EUR – 10%
Equity 233 – (35) (33)
Net income (8) (4) 1 0