Reebok 2015 Annual Report Download - page 249
Download and view the complete annual report
Please find page 249 of the 2015 Reebok annual report below. You can navigate through the pages in the report by either clicking on the pages listed below, or by using the keyword search tool below to find specific information within the annual report.-
 1
1 -
2
-
3
-
4
-
5
-
6
-
7
-
8
-
9
-
10
-
11
-
12
-
13
-
14
-
15
-
16
-
17
-
18
-
19
-
20
-
21
-
22
-
23
-
24
-
25
-
26
-
27
-
28
-
29
-
30
-
31
-
32
-
33
-
34
-
35
-
36
-
37
-
38
-
39
-
40
-
41
-
42
-
43
-
44
-
45
-
46
-
47
-
48
-
49
-
50
-
51
-
52
-
53
-
54
-
55
-
56
-
57
-
58
-
59
-
60
-
61
-
62
-
63
-
64
-
65
-
66
-
67
-
68
-
69
-
70
-
71
-
72
-
73
-
74
-
75
-
76
-
77
-
78
-
79
-
80
-
81
-
82
-
83
-
84
-
85
-
86
-
87
-
88
-
89
-
90
-
91
-
92
-
93
-
94
-
95
-
96
-
97
-
98
-
99
-
100
-
101
-
102
-
103
-
104
-
105
-
106
-
107
-
108
-
109
-
110
-
111
-
112
-
113
-
114
-
115
-
116
-
117
-
118
-
119
-
120
-
121
-
122
-
123
-
124
-
125
-
126
-
127
-
128
-
129
-
130
-
131
-
132
-
133
-
134
-
135
-
136
-
137
-
138
-
139
-
140
-
141
-
142
-
143
-
144
-
145
-
146
-
147
-
148
-
149
-
150
-
151
-
152
-
153
-
154
-
155
-
156
-
157
-
158
-
159
-
160
-
161
-
162
-
163
-
164
-
165
-
166
-
167
-
168
-
169
-
170
-
171
-
172
-
173
-
174
-
175
-
176
-
177
-
178
-
179
-
180
-
181
-
182
-
183
-
184
-
185
-
186
-
187
-
188
-
189
-
190
-
191
-
192
-
193
-
194
-
195
-
196
-
197
-
198
-
199
-
200
-
201
-
202
-
203
-
204
-
205
-
206
-
207
-
208
-
209
-
210
-
211
-
212
-
213
-
214
-
215
-
216
-
217
-
218
-
219
-
220
-
221
-
222
-
223
-
224
-
225
-
226
-
227
-
228
-
229
-
230
-
231
-
232
-
233
-
234
-
235
-
236
-
237
-
238
-
 239
239 -
 240
240 -
 241
241 -
 242
242 -
 243
243 -
 244
244 -
 245
245 -
 246
246 -
 247
247 -
 248
248 -
 249
249 -
 250
250 -
 251
251 -
 252
252 -
 253
253 -
 254
254 -
 255
255 -
 256
256 -
 257
257 -
 258
258 -
 259
259 -
260
-
261
-
262
-
263
-
264
-
265
-
266
-
267
-
268
-
269
-
270
 |
 |

245
4
CONSOLIDATED FINANCIAL STATEMENTS
Notes – Additional Information
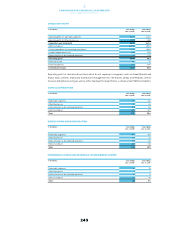
GEOGRAPHICAL INFORMATION
€ in millions Net sales (non-Group) Non-current assets
Year ending
Dec. 31, 2015
Year ending
Dec. 31, 2014
Dec. 31, 2015 Dec. 31, 2014
Western Europe 4,937 4,135 1,960 1,619
North America 3,620 3,124 1,177 1,107
Greater China 2,491 1,811 462 358
CIS 757 1,129 363 380
Latin America 1,797 1,627 282 236
Japan 947 917 193 157
MEAA 2,525 2,073 533 465
HQ/Consolidation 0 0 – 0
Reclassification to discontinued operations (159) (283) – –
Total 16,915 14,534 4,970 4,322
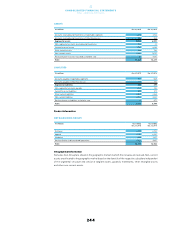
With regard to Germany, Western Europe contains net sales (non-Group) (continuing operations)
amounting to € 936 million and € 891 million as well as non-current assets amounting to € 846 million
and € 806 million for the years 2015 and 2014, respectively. With regard to the USA, North America contains
net sales (non-Group) (continuing operations) amounting to € 3.091 billion and € 2.579 billion as well as
non-current assets amounting to € 967 million and € 940 million for the years 2015 and 2014, respectively.
In 2015, the increase in cash generated from operating activities compared to the prior year was primarily
due to an increase in income before taxes, partly offset by an increase in income taxes paid.
Net cash outflow from investing activities in 2015 mainly related to spending for property, plant and
equipment such as investments in the furnishing and fitting of own-retail stores, in new office buildings,
warehouses and IT systems as well as to the acquisition of Runtastic. These cash outflows were partly
offset by proceeds from the divestiture of the Rockport operating segment.
Cash outflows from financing activities mainly related to the dividend paid to shareholders of adidas AG
and to the repurchase of treasury shares.
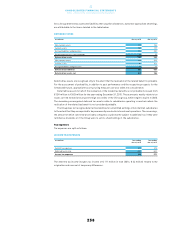
NETCASH USED IN/GENERATED FROM DISCONTINUED OPERATIONS
€ in millions Year ending
Dec. 31, 2015
Year ending
Dec. 31, 2014
Net cash generated from operating activities 3 7
Net cash used in investing activities (6) (6)
Net cash (used in)/generated from financing activities – –
Net cash (used in)/generated from discontinued operations (3) 1
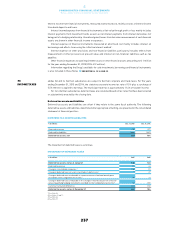
Other financial commitments
The Group has other financial commitments (continuing operations) for promotion and advertising contracts,
which mature as follows:
FINANCIALCOMMITMENTS FOR PROMOTION ANDADVERTISING
€ in millions Dec. 31, 2015 Dec. 31, 2014
Within 1 year 982 836
Between 1 and 5 years 2,593 2,590
After 5 years 2,204 1,766
Total 5,779 5,193
37
ADDITIONALCASH
FLOW INFORMATION
38
COMMITMENTSAND
CONTINGENCIES