Reebok 2015 Annual Report Download - page 210
Download and view the complete annual report
Please find page 210 of the 2015 Reebok annual report below. You can navigate through the pages in the report by either clicking on the pages listed below, or by using the keyword search tool below to find specific information within the annual report.-
 1
1 -
2
-
3
-
4
-
5
-
6
-
7
-
8
-
9
-
10
-
11
-
12
-
13
-
14
-
15
-
16
-
17
-
18
-
19
-
20
-
21
-
22
-
23
-
24
-
25
-
26
-
27
-
28
-
29
-
30
-
31
-
32
-
33
-
34
-
35
-
36
-
37
-
38
-
39
-
40
-
41
-
42
-
43
-
44
-
45
-
46
-
47
-
48
-
49
-
50
-
51
-
52
-
53
-
54
-
55
-
56
-
57
-
58
-
59
-
60
-
61
-
62
-
63
-
64
-
65
-
66
-
67
-
68
-
69
-
70
-
71
-
72
-
73
-
74
-
75
-
76
-
77
-
78
-
79
-
80
-
81
-
82
-
83
-
84
-
85
-
86
-
87
-
88
-
89
-
90
-
91
-
92
-
93
-
94
-
95
-
96
-
97
-
98
-
99
-
100
-
101
-
102
-
103
-
104
-
105
-
106
-
107
-
108
-
109
-
110
-
111
-
112
-
113
-
114
-
115
-
116
-
117
-
118
-
119
-
120
-
121
-
122
-
123
-
124
-
125
-
126
-
127
-
128
-
129
-
130
-
131
-
132
-
133
-
134
-
135
-
136
-
137
-
138
-
139
-
140
-
141
-
142
-
143
-
144
-
145
-
146
-
147
-
148
-
149
-
150
-
151
-
152
-
153
-
154
-
155
-
156
-
157
-
158
-
159
-
160
-
161
-
162
-
163
-
164
-
165
-
166
-
167
-
168
-
169
-
170
-
171
-
172
-
173
-
174
-
175
-
176
-
177
-
178
-
179
-
180
-
181
-
182
-
183
-
184
-
185
-
186
-
187
-
188
-
189
-
190
-
191
-
192
-
193
-
194
-
195
-
196
-
197
-
198
-
199
-
 200
200 -
 201
201 -
 202
202 -
 203
203 -
 204
204 -
 205
205 -
 206
206 -
 207
207 -
 208
208 -
 209
209 -
 210
210 -
 211
211 -
 212
212 -
 213
213 -
 214
214 -
 215
215 -
 216
216 -
 217
217 -
 218
218 -
 219
219 -
 220
220 -
221
-
222
-
223
-
224
-
225
-
226
-
227
-
228
-
229
-
230
-
231
-
232
-
233
-
234
-
235
-
236
-
237
-
238
-
239
-
240
-
241
-
242
-
243
-
244
-
245
-
246
-
247
-
248
-
249
-
250
-
251
-
252
-
253
-
254
-
255
-
256
-
257
-
258
-
259
-
260
-
261
-
262
-
263
-
264
-
265
-
266
-
267
-
268
-
269
-
270
 |
 |
206
4
CONSOLIDATED FINANCIAL STATEMENTS
Notes – Notes to the Consolidated Statement of Financial Position
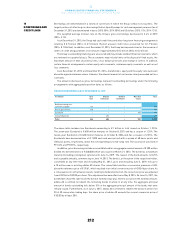
At December 31, 2014, impairment losses of € 104 million (before transaction costs) for write-downs of the
disposal group Rockport to the lower of its carrying amount and its fair value less costs to sell have been
included in ‘Losses/gains from discontinued operations, net of tax’
SEE NOTE 03
. At December 31, 2014,
the fair value less costs to sell amounted to € 211 million. The impairment losses have been applied to
reduce the carrying amount of goodwill, trademarks and other intangible assets as well as property, plant
and equipment.
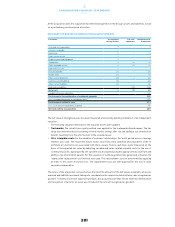
At December 31, 2014, the disposal group Rockport was stated at fair value less costs to sell and
comprised the following major classes of assets and liabilities:
CLASSES OF ASSETSAND LIABILITIES
€ in millions Dec. 31, 2014
Accounts receivable 49
Other current financial assets 1
Inventories 88
Total current assets 139
Property, plant and equipment 7
Trademarks 112
Other intangible assets 1
Total non-current assets 121
Total assets 260
Accounts payable 37
Other current provisions 1
Current accrued liabilities 6
Other current liabilities 2
Total current liabilities 46
Total liabilities 46
The non-recurring fair value measurement for the disposal group has been categorised as a Level 3 fair
value. The fair value is based on the sale and purchase agreement for the Rockport business which was
signed on January 23, 2015 SEE NOTE 03.
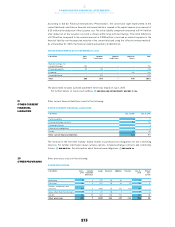
Property, plant and equipment consist of the following:
PROPERTY, PLANTAND EQUIPMENT
€ in millions Dec. 31, 2015 Dec. 31, 2014
Land, land leases, buildings and leasehold improvements 1,319 1,073
Technical equipment and machinery 300 268
Other equipment as well as furniture and fixtures 1,502 1,323
3,121 2,664
Less: accumulated depreciation and impairment losses (1,583) (1,369)
1,538 1,296
Construction in progress, net 100 159
Property, plant and equipment, net 1,638 1,454
Depreciation expenses were € 279 million and € 258 million for the years ending December 31, 2015 and
2014, respectively SEE NOTE 31.
12
PROPERTY, PLANT
AND EQUIPMENT