Reebok 2015 Annual Report Download - page 115
Download and view the complete annual report
Please find page 115 of the 2015 Reebok annual report below. You can navigate through the pages in the report by either clicking on the pages listed below, or by using the keyword search tool below to find specific information within the annual report.-
 1
1 -
2
-
3
-
4
-
5
-
6
-
7
-
8
-
9
-
10
-
11
-
12
-
13
-
14
-
15
-
16
-
17
-
18
-
19
-
20
-
21
-
22
-
23
-
24
-
25
-
26
-
27
-
28
-
29
-
30
-
31
-
32
-
33
-
34
-
35
-
36
-
37
-
38
-
39
-
40
-
41
-
42
-
43
-
44
-
45
-
46
-
47
-
48
-
49
-
50
-
51
-
52
-
53
-
54
-
55
-
56
-
57
-
58
-
59
-
60
-
61
-
62
-
63
-
64
-
65
-
66
-
67
-
68
-
69
-
70
-
71
-
72
-
73
-
74
-
75
-
76
-
77
-
78
-
79
-
80
-
81
-
82
-
83
-
84
-
85
-
86
-
87
-
88
-
89
-
90
-
91
-
92
-
93
-
94
-
95
-
96
-
97
-
98
-
99
-
100
-
101
-
102
-
103
-
104
-
 105
105 -
 106
106 -
 107
107 -
 108
108 -
 109
109 -
 110
110 -
 111
111 -
 112
112 -
 113
113 -
 114
114 -
 115
115 -
 116
116 -
 117
117 -
 118
118 -
 119
119 -
 120
120 -
 121
121 -
 122
122 -
 123
123 -
 124
124 -
 125
125 -
126
-
127
-
128
-
129
-
130
-
131
-
132
-
133
-
134
-
135
-
136
-
137
-
138
-
139
-
140
-
141
-
142
-
143
-
144
-
145
-
146
-
147
-
148
-
149
-
150
-
151
-
152
-
153
-
154
-
155
-
156
-
157
-
158
-
159
-
160
-
161
-
162
-
163
-
164
-
165
-
166
-
167
-
168
-
169
-
170
-
171
-
172
-
173
-
174
-
175
-
176
-
177
-
178
-
179
-
180
-
181
-
182
-
183
-
184
-
185
-
186
-
187
-
188
-
189
-
190
-
191
-
192
-
193
-
194
-
195
-
196
-
197
-
198
-
199
-
200
-
201
-
202
-
203
-
204
-
205
-
206
-
207
-
208
-
209
-
210
-
211
-
212
-
213
-
214
-
215
-
216
-
217
-
218
-
219
-
220
-
221
-
222
-
223
-
224
-
225
-
226
-
227
-
228
-
229
-
230
-
231
-
232
-
233
-
234
-
235
-
236
-
237
-
238
-
239
-
240
-
241
-
242
-
243
-
244
-
245
-
246
-
247
-
248
-
249
-
250
-
251
-
252
-
253
-
254
-
255
-
256
-
257
-
258
-
259
-
260
-
261
-
262
-
263
-
264
-
265
-
266
-
267
-
268
-
269
-
270
 |
 |
111
3
GROUP MANAGEMENT REPORT – FINANCIAL REVIEW
Group Business Performance – Income Statement
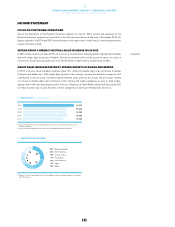
INCOME STATEMENT
FOCUS ON CONTINUING OPERATIONS
Due to the divestiture of the Rockport business segment on July 31, 2015, income and expenses of the
Rockport business segment are reported as discontinued operations at the end of December 2015. All
figures related to the 2014 and 2015 financial years in this report refer to the Group’s continuing operations
unless otherwise stated.
ADIDAS GROUP CURRENCY-NEUTRAL SALES INCREASE 10% IN 2015
In 2015, Group revenues increased 10% on a currency-neutral basis, driven by double-digit growth at adidas
and mid-single-digit increases at Reebok. Currency translation effects had a positive impact on sales in
euro terms. Group revenues grew 16% to € 16.915 billion in 2015 from € 14.534 billion in 2014.
GROUP SALES INCREASE DRIVEN BYSTRONG GROWTH ATADIDASAND REEBOK
In 2015, currency-neutral adidas revenues grew 12%, driven by double-digit sales increases at adidas
Originals and adidas neo. Mid-single-digit growth in the training, running and football categories also
contributed to the increase. Currency-neutral Reebok sales were up 6% versus the prior year, mainly
as a result of double-digit sales increases in the training and studio categories as well as high-single-
digit growth in the running category and in Classics. Revenues at TaylorMade-adidas Golf decreased 13%
currency-neutral, due to sales declines in most categories, in particular metalwoods and irons.
see Diagram 07
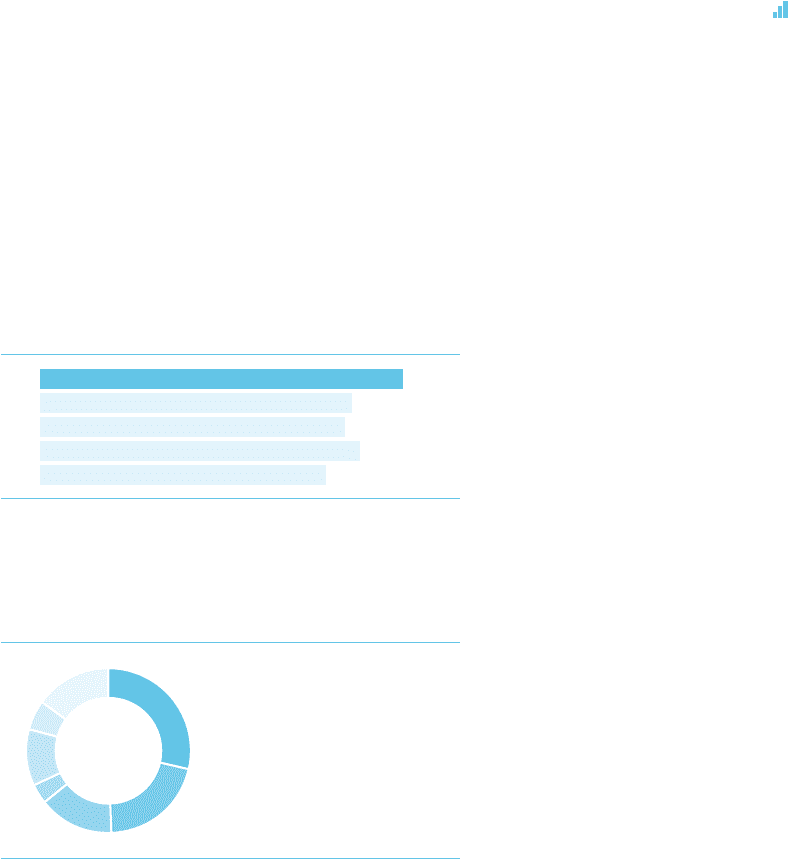
07NETSALES 1, 2€ IN MILLIONS
2015 16,915
2014 14,534
2013 14,203
2012 14,883
2011 13,322
1 2015, 2014 and 2013 reflect continuing operations as a result of the divestiture of the
Rockport business.
2 2011 restated according to IAS 8 in the 2012 consolidated financial statements.
08NETSALES BY REGION 1
29%
21%
15%
4%
11%
6%
15%
Western Europe
North America
Greater China
Russia/CIS
Latin America
Japan
MEAA
1 Figures reflect all operating activities of the adidas Group’s operating segments, including
Other Businesses.
29
21
4
15
11
6
15