Reebok 2015 Annual Report Download - page 114
Download and view the complete annual report
Please find page 114 of the 2015 Reebok annual report below. You can navigate through the pages in the report by either clicking on the pages listed below, or by using the keyword search tool below to find specific information within the annual report.-
 1
1 -
2
-
3
-
4
-
5
-
6
-
7
-
8
-
9
-
10
-
11
-
12
-
13
-
14
-
15
-
16
-
17
-
18
-
19
-
20
-
21
-
22
-
23
-
24
-
25
-
26
-
27
-
28
-
29
-
30
-
31
-
32
-
33
-
34
-
35
-
36
-
37
-
38
-
39
-
40
-
41
-
42
-
43
-
44
-
45
-
46
-
47
-
48
-
49
-
50
-
51
-
52
-
53
-
54
-
55
-
56
-
57
-
58
-
59
-
60
-
61
-
62
-
63
-
64
-
65
-
66
-
67
-
68
-
69
-
70
-
71
-
72
-
73
-
74
-
75
-
76
-
77
-
78
-
79
-
80
-
81
-
82
-
83
-
84
-
85
-
86
-
87
-
88
-
89
-
90
-
91
-
92
-
93
-
94
-
95
-
96
-
97
-
98
-
99
-
100
-
101
-
102
-
103
-
 104
104 -
 105
105 -
 106
106 -
 107
107 -
 108
108 -
 109
109 -
 110
110 -
 111
111 -
 112
112 -
 113
113 -
 114
114 -
 115
115 -
 116
116 -
 117
117 -
 118
118 -
 119
119 -
 120
120 -
 121
121 -
 122
122 -
 123
123 -
 124
124 -
125
-
126
-
127
-
128
-
129
-
130
-
131
-
132
-
133
-
134
-
135
-
136
-
137
-
138
-
139
-
140
-
141
-
142
-
143
-
144
-
145
-
146
-
147
-
148
-
149
-
150
-
151
-
152
-
153
-
154
-
155
-
156
-
157
-
158
-
159
-
160
-
161
-
162
-
163
-
164
-
165
-
166
-
167
-
168
-
169
-
170
-
171
-
172
-
173
-
174
-
175
-
176
-
177
-
178
-
179
-
180
-
181
-
182
-
183
-
184
-
185
-
186
-
187
-
188
-
189
-
190
-
191
-
192
-
193
-
194
-
195
-
196
-
197
-
198
-
199
-
200
-
201
-
202
-
203
-
204
-
205
-
206
-
207
-
208
-
209
-
210
-
211
-
212
-
213
-
214
-
215
-
216
-
217
-
218
-
219
-
220
-
221
-
222
-
223
-
224
-
225
-
226
-
227
-
228
-
229
-
230
-
231
-
232
-
233
-
234
-
235
-
236
-
237
-
238
-
239
-
240
-
241
-
242
-
243
-
244
-
245
-
246
-
247
-
248
-
249
-
250
-
251
-
252
-
253
-
254
-
255
-
256
-
257
-
258
-
259
-
260
-
261
-
262
-
263
-
264
-
265
-
266
-
267
-
268
-
269
-
270
 |
 |

110
3
GROUP MANAGEMENT REPORT – FINANCIAL REVIEW
Group Business Performance – Economic and Sector Development
In North America, the sporting goods industry posted a robust performance, benefiting from rising real
disposable income and low inflationary pressure within the region. From a category perspective, casual
athletic footwear continued to be in strong demand, fuelled by sales growth both in classics and in lifestyle
silhouettes, outperforming other categories. While basketball footwear posted modest growth driven by
lifestyle basketball, running footwear sales benefited mainly from fashion styles. In addition, sales in
sports apparel saw a modest decline and were negatively impacted by unfavourable weather conditions.
Although further signs of a slow recovery in the golf market appeared during the second half of 2015 due
to unseasonably warm weather and new product introductions, structural changes continued to persist.
In Asia, low inflationary pressures and wage growth bolstered disposable income and consumer spending,
promoting the expansion of the sporting goods industry. This trend was particularly evident in China,
supporting healthy industry growth, especially in the lower-tier cities. Sporting goods sales in Japan saw
improvements as the year developed, driven by stronger consumer spending and domestic demand. In
India, the size of the sector continued to expand at a strong pace.
The sporting goods industry in Latin America grew only slightly in 2015, as low unemployment levels and
wage increases were partially offset by high inflationary pressures and subdued consumer spending. In
particular Brazil, a market which benefited the most in the prior year from the 2014 FIFA World Cup, was
negatively impacted by these developments.
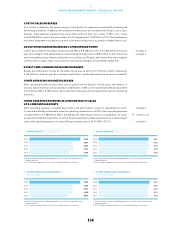
05EXCHANGE RATE DEVELOPMENT 1€ 1 EQUALS
Average
rate 2014
Q1 2015 Q2 2015 Q3 2015 Q4 2015 Average
rate 2015
USD 1.3296 1.0759 1.1189 1.1203 1.0887 1.1101
GBP 0.8066 0.7273 0.7114 0.7385 0.7340 0.7259
JPY 140.44 128.95 137.01 134.69 131.07 134.42
RUB 50.737 62.902 62.126 74.205 79.347 67.682
CNY 8.1919 6.6084 6.8405 7.1266 7.0696 6.9721
1 Spot rates at quarter-end.
06 2015 OIL PRICE DEVELOPMENT 1IN US $ PER BARREL
| Jan. 1, 2015 Dec. 31, 2015 |
70
50
30
1 West Texas Intermediate Cushing crude oil. Source: Bloomberg.