Reebok 2015 Annual Report Download - page 53
Download and view the complete annual report
Please find page 53 of the 2015 Reebok annual report below. You can navigate through the pages in the report by either clicking on the pages listed below, or by using the keyword search tool below to find specific information within the annual report.-
 1
1 -
2
-
3
-
4
-
5
-
6
-
7
-
8
-
9
-
10
-
11
-
12
-
13
-
14
-
15
-
16
-
17
-
18
-
19
-
20
-
21
-
22
-
23
-
24
-
25
-
26
-
27
-
28
-
29
-
30
-
31
-
32
-
33
-
34
-
35
-
36
-
37
-
38
-
39
-
40
-
41
-
42
-
 43
43 -
 44
44 -
 45
45 -
 46
46 -
 47
47 -
 48
48 -
 49
49 -
 50
50 -
 51
51 -
 52
52 -
 53
53 -
 54
54 -
 55
55 -
 56
56 -
 57
57 -
 58
58 -
 59
59 -
 60
60 -
 61
61 -
 62
62 -
 63
63 -
64
-
65
-
66
-
67
-
68
-
69
-
70
-
71
-
72
-
73
-
74
-
75
-
76
-
77
-
78
-
79
-
80
-
81
-
82
-
83
-
84
-
85
-
86
-
87
-
88
-
89
-
90
-
91
-
92
-
93
-
94
-
95
-
96
-
97
-
98
-
99
-
100
-
101
-
102
-
103
-
104
-
105
-
106
-
107
-
108
-
109
-
110
-
111
-
112
-
113
-
114
-
115
-
116
-
117
-
118
-
119
-
120
-
121
-
122
-
123
-
124
-
125
-
126
-
127
-
128
-
129
-
130
-
131
-
132
-
133
-
134
-
135
-
136
-
137
-
138
-
139
-
140
-
141
-
142
-
143
-
144
-
145
-
146
-
147
-
148
-
149
-
150
-
151
-
152
-
153
-
154
-
155
-
156
-
157
-
158
-
159
-
160
-
161
-
162
-
163
-
164
-
165
-
166
-
167
-
168
-
169
-
170
-
171
-
172
-
173
-
174
-
175
-
176
-
177
-
178
-
179
-
180
-
181
-
182
-
183
-
184
-
185
-
186
-
187
-
188
-
189
-
190
-
191
-
192
-
193
-
194
-
195
-
196
-
197
-
198
-
199
-
200
-
201
-
202
-
203
-
204
-
205
-
206
-
207
-
208
-
209
-
210
-
211
-
212
-
213
-
214
-
215
-
216
-
217
-
218
-
219
-
220
-
221
-
222
-
223
-
224
-
225
-
226
-
227
-
228
-
229
-
230
-
231
-
232
-
233
-
234
-
235
-
236
-
237
-
238
-
239
-
240
-
241
-
242
-
243
-
244
-
245
-
246
-
247
-
248
-
249
-
250
-
251
-
252
-
253
-
254
-
255
-
256
-
257
-
258
-
259
-
260
-
261
-
262
-
263
-
264
-
265
-
266
-
267
-
268
-
269
-
270
 |
 |

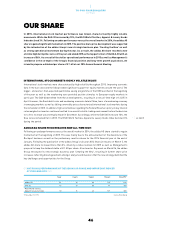
TO OUR SHAREHOLDERS
Our Share
49
1
AVERAGE DAILY TRADINGVOLUME DECREASES SLIGHTLY
During 2015, the average daily trading volume of the adidas AG share on all German stock exchanges
(excluding bank trades) declined slightly to 1.2 million shares (2014: 1.4 million). The average daily trading
volume of the adidas AG share on alternative trading systems, such as CHI-X, Turquoise and BATS Europe,
increased slightly to 1.0 million shares per trading day (2014: 0.9 million). Share trading on OTC markets
such as BOAT and EuroNext OTC remained stable at 0.5 million shares per trading day (2014: 0.5 million).
LEVEL 1 ADR PERFORMS IN LINE WITH COMMON STOCK
Our Level 1 ADR closed 2015 at US $ 48.51, representing an increase of 41% versus the prior year level
(2014: US $ 34.51). The less pronounced increase of the Level 1 ADR price compared to the ordinary share
price was due to the appreciation of the US dollar versus the euro at the end of 2015 compared to year-end
2014. The number of Level 1 ADRs outstanding increased to 8.6 million at year-end 2015 compared to
5.9 million at the end of 2014. The average daily trading volume increased to 92,100 ADRs in 2015 (2014:
80,800). Further information on our ADR Programme can be found on our website.
ADIDASAG SHARE MEMBER OF IMPORTANT INDICES
The adidas AG share is included in a variety of high-quality indices around the world, most importantly
the DAX-30 and the MSCI World Textiles, Apparel & Luxury Goods Index, which comprises our Group’s
major competitors. At December 31, 2015, our weighting in the DAX-30, which is calculated on the basis
of free float market capitalisation and twelve-month share turnover, increased to 2.15% (2014: 1.47%).
Our higher weighting compared to the prior year was mainly due to the increase in market capitalisation
of adidas AG, which more than offset the decrease in share turnover. Within the DAX-30, we ranked 17 on
market capitalisation (2014: 21) and 16 on turnover (2014: 15) at year-end 2015. Additionally, in recognition
of our social and environmental efforts, adidas AG is listed in several key sustainability indices.
CONVERTIBLE BOND CLOSESTHE YEAR AT € 125.82
In March 2012, adidas AG successfully issued a convertible bond, due on June 14, 2019, for an aggregate
nominal amount of € 500 million. The bonds are not callable by the issuer or putable by the bondholders
until June 2017. The bonds are convertible into up to 6.1 million new or existing adidas AG shares. Proceeds
from the offering have allowed the Group to further optimise its debt structure. The bonds were priced with a
0.25% annual coupon and a conversion premium of 40% above the reference price of € 59.61, resulting in an
initial conversion price of € 83.46 per share. As a consequence of contractual provisions relating to dividend
protection, the conversion price was adjusted to € 82.00 per share. This adjustment became effective on
May 8, 2015. The convertible bond closed the year at € 125.82, above the prior year level of € 108.95.
DIVIDEND PROPOSALOF € 1.60 PER SHARE
As a result of the stellar operational performance in 2015, the Group’s strong financial position as well as
Management’s confidence in our long-term growth aspirations, the adidas AG Executive and Supervisory
Boards will recommend paying a dividend of € 1.60 per share to shareholders at the Annual General
Meeting (AGM) on May 12, 2016. This represents an increase of 7% compared to the prior year dividend
(2014: € 1.50), which was kept stable despite a decline in net income attributable to shareholders in 2014.
Subject to the meeting’s approval, the dividend will be paid on May 13, 2016. The total payout of € 320 million
(2014: € 306 million) reflects a payout ratio of 47.9% of net income attributable to shareholders, excluding
goodwill impairment losses. The payout ratio for 2015 is at the upper end of the increased target range
of between 30% and 50% of net income attributable to shareholders as defined in our dividend policy. In
the prior year, Management had decided to keep the dividend stable despite a significant decline in net
income, resulting in a payout ratio of 53.9%.
see Table 03
www.adidas-group.com/adr
see Table 03
see Note 18, p. 212
see Table 03