Reebok 2015 Annual Report Download - page 144
Download and view the complete annual report
Please find page 144 of the 2015 Reebok annual report below. You can navigate through the pages in the report by either clicking on the pages listed below, or by using the keyword search tool below to find specific information within the annual report.-
 1
1 -
2
-
3
-
4
-
5
-
6
-
7
-
8
-
9
-
10
-
11
-
12
-
13
-
14
-
15
-
16
-
17
-
18
-
19
-
20
-
21
-
22
-
23
-
24
-
25
-
26
-
27
-
28
-
29
-
30
-
31
-
32
-
33
-
34
-
35
-
36
-
37
-
38
-
39
-
40
-
41
-
42
-
43
-
44
-
45
-
46
-
47
-
48
-
49
-
50
-
51
-
52
-
53
-
54
-
55
-
56
-
57
-
58
-
59
-
60
-
61
-
62
-
63
-
64
-
65
-
66
-
67
-
68
-
69
-
70
-
71
-
72
-
73
-
74
-
75
-
76
-
77
-
78
-
79
-
80
-
81
-
82
-
83
-
84
-
85
-
86
-
87
-
88
-
89
-
90
-
91
-
92
-
93
-
94
-
95
-
96
-
97
-
98
-
99
-
100
-
101
-
102
-
103
-
104
-
105
-
106
-
107
-
108
-
109
-
110
-
111
-
112
-
113
-
114
-
115
-
116
-
117
-
118
-
119
-
120
-
121
-
122
-
123
-
124
-
125
-
126
-
127
-
128
-
129
-
130
-
131
-
132
-
133
-
 134
134 -
 135
135 -
 136
136 -
 137
137 -
 138
138 -
 139
139 -
 140
140 -
 141
141 -
 142
142 -
 143
143 -
 144
144 -
 145
145 -
 146
146 -
 147
147 -
 148
148 -
 149
149 -
 150
150 -
 151
151 -
 152
152 -
 153
153 -
 154
154 -
155
-
156
-
157
-
158
-
159
-
160
-
161
-
162
-
163
-
164
-
165
-
166
-
167
-
168
-
169
-
170
-
171
-
172
-
173
-
174
-
175
-
176
-
177
-
178
-
179
-
180
-
181
-
182
-
183
-
184
-
185
-
186
-
187
-
188
-
189
-
190
-
191
-
192
-
193
-
194
-
195
-
196
-
197
-
198
-
199
-
200
-
201
-
202
-
203
-
204
-
205
-
206
-
207
-
208
-
209
-
210
-
211
-
212
-
213
-
214
-
215
-
216
-
217
-
218
-
219
-
220
-
221
-
222
-
223
-
224
-
225
-
226
-
227
-
228
-
229
-
230
-
231
-
232
-
233
-
234
-
235
-
236
-
237
-
238
-
239
-
240
-
241
-
242
-
243
-
244
-
245
-
246
-
247
-
248
-
249
-
250
-
251
-
252
-
253
-
254
-
255
-
256
-
257
-
258
-
259
-
260
-
261
-
262
-
263
-
264
-
265
-
266
-
267
-
268
-
269
-
270
 |
 |
140
3
GROUP MANAGEMENT REPORT – FINANCIAL REVIEW
Business Performance by Segment – North America
NORTH AMERICA
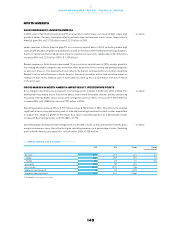
SALES INCREASE 5% IN NORTH AMERICA
In 2015, sales in North America increased 5% on a currency-neutral basis, as a result of high-single-digit
growth at adidas. Currency translation effects positively impacted revenues in euro terms. Sales in North
America grew 24% to € 2.753 billion from € 2.217 billion in 2014.
adidas revenues in North America grew 9% on a currency-neutral basis in 2015, reflecting double-digit
sales growth at adidas Originals and adidas neo as well as increases in the football and training categories.
Currency translation effects had a positive impact on revenues in euro terms. adidas sales in North America
increased 28% to € 2.231 billion (2014: € 1.739 billion).
Reebok revenues in North America decreased 7% on a currency-neutral basis in 2015, as sales growth in
the training and studio categories was more than offset by declines in the running and walking categories
as well as in Classics. This development also reflects the brand’s continued efforts to further streamline
Reebok’s factory outlet business in North America. Currency translation effects had a positive impact on
revenues in euro terms. Reebok sales in North America were up 9% to € 523 million from € 477 million
in the prior year.
GROSS MARGIN IN NORTH AMERICA IMPROVES BY 1.1 PERCENTAGE POINTS
Gross margin in North America increased 1.1 percentage points to 36.6% in 2015 from 35.5% in 2014. This
development was mainly due to the positive effects from a more favourable channel, product and pricing
mix, partly offset by higher input costs as well as negative currency effects. Gross profit in North America
increased 28% to € 1.008 billion versus € 787 million in 2014.
Operating expenses were up 39% to € 977 million versus € 702 million in 2014. This reflects the planned
significant increase in expenditure for point-of-sale and marketing investments as well as sales expenditure
to support the company’s growth in the region. As a result, operating expenses as a percentage of sales
increased 3.8 percentage points to 35.5% (2014: 31.7%).
Operating margin decreased 2.9 percentage points to 2.5% (2014: 5.4%), as the positive effect from the gross
margin increase was more than offset by higher operating expenses as a percentage of sales. Operating
profit in North America decreased 42% to € 69 million (2014: € 120 million).
see Table 03
see Table 03
see Table 03
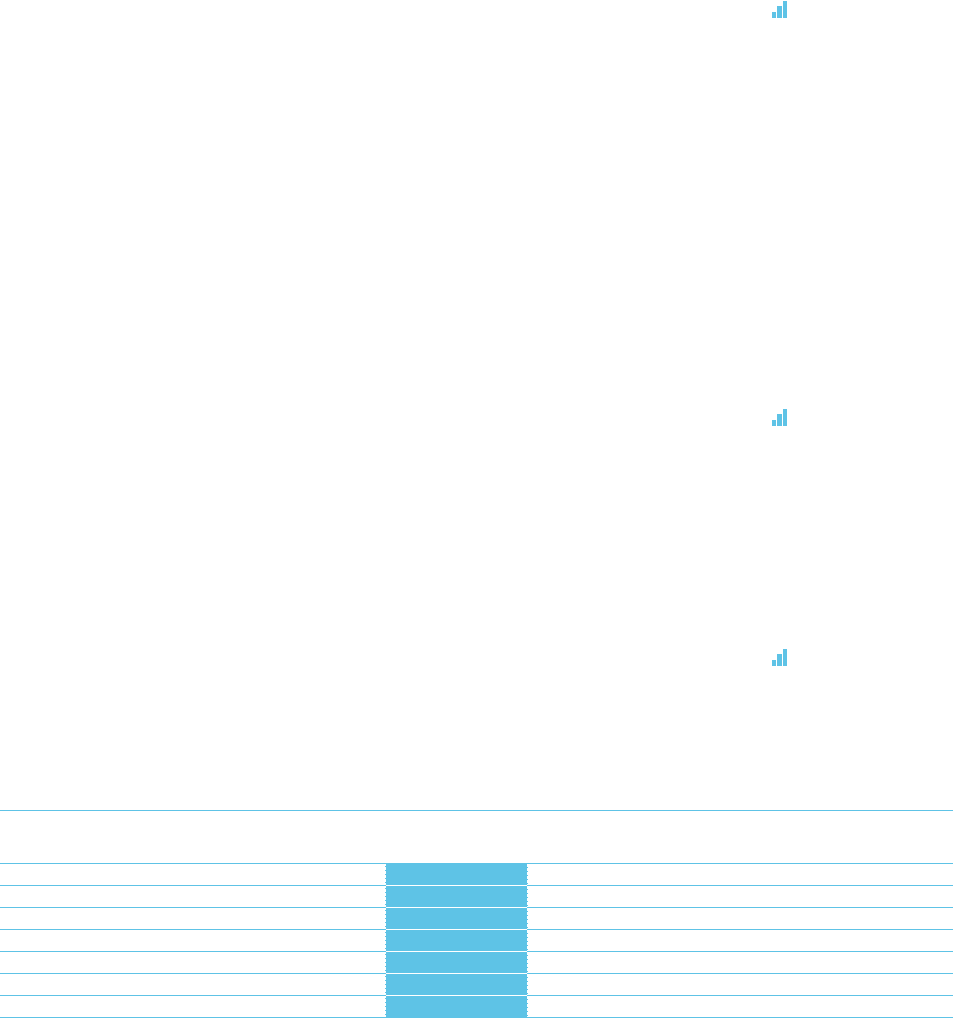
03NORTH AMERICA ATAGLANCE€ IN MILLIONS
2015 2014 Change Change
(currency-neutral)
Net sales 12,753 2,217 24% 5%
adidas 2,231 1,739 28% 9%
Reebok 523 477 9% (7%)
Gross profit 1,008 787 28% –
Gross margin 36.6% 35.5% 1.1pp –
Segmental operating profit 69 120 (42%) –
Segmental operating margin 2.5% 5.4% (2.9pp) –
1 Rounding differences may arise in totals.