Reebok 2015 Annual Report Download - page 234
Download and view the complete annual report
Please find page 234 of the 2015 Reebok annual report below. You can navigate through the pages in the report by either clicking on the pages listed below, or by using the keyword search tool below to find specific information within the annual report.-
 1
1 -
2
-
3
-
4
-
5
-
6
-
7
-
8
-
9
-
10
-
11
-
12
-
13
-
14
-
15
-
16
-
17
-
18
-
19
-
20
-
21
-
22
-
23
-
24
-
25
-
26
-
27
-
28
-
29
-
30
-
31
-
32
-
33
-
34
-
35
-
36
-
37
-
38
-
39
-
40
-
41
-
42
-
43
-
44
-
45
-
46
-
47
-
48
-
49
-
50
-
51
-
52
-
53
-
54
-
55
-
56
-
57
-
58
-
59
-
60
-
61
-
62
-
63
-
64
-
65
-
66
-
67
-
68
-
69
-
70
-
71
-
72
-
73
-
74
-
75
-
76
-
77
-
78
-
79
-
80
-
81
-
82
-
83
-
84
-
85
-
86
-
87
-
88
-
89
-
90
-
91
-
92
-
93
-
94
-
95
-
96
-
97
-
98
-
99
-
100
-
101
-
102
-
103
-
104
-
105
-
106
-
107
-
108
-
109
-
110
-
111
-
112
-
113
-
114
-
115
-
116
-
117
-
118
-
119
-
120
-
121
-
122
-
123
-
124
-
125
-
126
-
127
-
128
-
129
-
130
-
131
-
132
-
133
-
134
-
135
-
136
-
137
-
138
-
139
-
140
-
141
-
142
-
143
-
144
-
145
-
146
-
147
-
148
-
149
-
150
-
151
-
152
-
153
-
154
-
155
-
156
-
157
-
158
-
159
-
160
-
161
-
162
-
163
-
164
-
165
-
166
-
167
-
168
-
169
-
170
-
171
-
172
-
173
-
174
-
175
-
176
-
177
-
178
-
179
-
180
-
181
-
182
-
183
-
184
-
185
-
186
-
187
-
188
-
189
-
190
-
191
-
192
-
193
-
194
-
195
-
196
-
197
-
198
-
199
-
200
-
201
-
202
-
203
-
204
-
205
-
206
-
207
-
208
-
209
-
210
-
211
-
212
-
213
-
214
-
215
-
216
-
217
-
218
-
219
-
220
-
221
-
222
-
223
-
 224
224 -
 225
225 -
 226
226 -
 227
227 -
 228
228 -
 229
229 -
 230
230 -
 231
231 -
 232
232 -
 233
233 -
 234
234 -
 235
235 -
 236
236 -
 237
237 -
 238
238 -
 239
239 -
 240
240 -
 241
241 -
 242
242 -
 243
243 -
 244
244 -
245
-
246
-
247
-
248
-
249
-
250
-
251
-
252
-
253
-
254
-
255
-
256
-
257
-
258
-
259
-
260
-
261
-
262
-
263
-
264
-
265
-
266
-
267
-
268
-
269
-
270
 |
 |
230
4
CONSOLIDATED FINANCIAL STATEMENTS
Notes – Notes to the Consolidated Statement of Financial Position
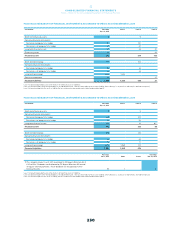
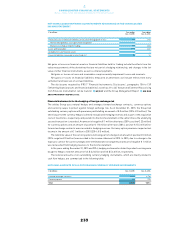
FAIR VALUE HIERARCHYOF FINANCIAL INSTRUMENTSACCORDINGTO IFRS 13 ASAT DECEMBER 31, 2015
€ in millions Fair value
Dec. 31, 2015
Level 1 Level 2 Level 3
Short-term financial assets 5 5
Derivative financial instruments
Derivatives being part of a hedge 181 181
Derivatives not being part of a hedge 47 47
Long-term financial assets 117 36 81
Promissory notes 42 42
Financial assets 392 269 123
Short-term borrowings 366 366
Derivative financial instruments
Derivatives being part of a hedge 36 36
Derivatives not being part of a hedge 26 26
Long-term borrowings 1,626 1,626
Earn-out components 21 21
Financial liabilities 2,075 1,626 428 21
Level 1 is based on quoted prices in active markets for identical assets or liabilities.
Level 2 is based on inputs other than quoted prices included within Level 1 that are observable for the asset or liability, either directly (i.e. as prices) or indirectly (i.e. derived from prices).
Level 3 is based on inputs for the asset or liability that are not based on observable market data (unobservable inputs).
FAIR VALUE HIERARCHYOF FINANCIAL INSTRUMENTSACCORDINGTO IFRS 13 ASAT DECEMBER 31, 2014
€ in millions Fair value
Dec. 31, 2014
Level 1 Level 2 Level 3
Short-term financial assets 5 5
Derivative financial instruments
Derivatives being part of a hedge 229 229
Derivatives not being part of a hedge 56 56
Long-term financial assets 113 33 80 1
Financial assets 403 323 80
Short-term borrowings 294 294
Derivative financial instruments
Derivatives being part of a hedge 44 44
Derivatives not being part of a hedge 11 11
Long-term borrowings 1,674 1,545 129
Financial liabilities 2,023 1,545 478
Fair value
Jan. 1, 2014 Gains Losses
Fair value
Dec. 31, 2014
1 This category relates to an 8.33% investment in FC Bayern München AG of
€ 80 million. Dividends are distributed by FC Bayern München AG instead
of regular interest payments. These dividends are recognised in other
financial income. 80 1 – 80
Level 1 is based on quoted prices in active markets for identical assets or liabilities.
Level 2 is based on inputs other than quoted prices included within Level 1 that are observable for the asset or liability, either directly (i.e. as prices) or indirectly (i.e. derived from prices).
Level 3 is based on inputs for the asset or liability that are not based on observable market data (unobservable inputs).