Reebok 2015 Annual Report Download - page 118
Download and view the complete annual report
Please find page 118 of the 2015 Reebok annual report below. You can navigate through the pages in the report by either clicking on the pages listed below, or by using the keyword search tool below to find specific information within the annual report.-
 1
1 -
2
-
3
-
4
-
5
-
6
-
7
-
8
-
9
-
10
-
11
-
12
-
13
-
14
-
15
-
16
-
17
-
18
-
19
-
20
-
21
-
22
-
23
-
24
-
25
-
26
-
27
-
28
-
29
-
30
-
31
-
32
-
33
-
34
-
35
-
36
-
37
-
38
-
39
-
40
-
41
-
42
-
43
-
44
-
45
-
46
-
47
-
48
-
49
-
50
-
51
-
52
-
53
-
54
-
55
-
56
-
57
-
58
-
59
-
60
-
61
-
62
-
63
-
64
-
65
-
66
-
67
-
68
-
69
-
70
-
71
-
72
-
73
-
74
-
75
-
76
-
77
-
78
-
79
-
80
-
81
-
82
-
83
-
84
-
85
-
86
-
87
-
88
-
89
-
90
-
91
-
92
-
93
-
94
-
95
-
96
-
97
-
98
-
99
-
100
-
101
-
102
-
103
-
104
-
105
-
106
-
107
-
 108
108 -
 109
109 -
 110
110 -
 111
111 -
 112
112 -
 113
113 -
 114
114 -
 115
115 -
 116
116 -
 117
117 -
 118
118 -
 119
119 -
 120
120 -
 121
121 -
 122
122 -
 123
123 -
 124
124 -
 125
125 -
 126
126 -
 127
127 -
 128
128 -
129
-
130
-
131
-
132
-
133
-
134
-
135
-
136
-
137
-
138
-
139
-
140
-
141
-
142
-
143
-
144
-
145
-
146
-
147
-
148
-
149
-
150
-
151
-
152
-
153
-
154
-
155
-
156
-
157
-
158
-
159
-
160
-
161
-
162
-
163
-
164
-
165
-
166
-
167
-
168
-
169
-
170
-
171
-
172
-
173
-
174
-
175
-
176
-
177
-
178
-
179
-
180
-
181
-
182
-
183
-
184
-
185
-
186
-
187
-
188
-
189
-
190
-
191
-
192
-
193
-
194
-
195
-
196
-
197
-
198
-
199
-
200
-
201
-
202
-
203
-
204
-
205
-
206
-
207
-
208
-
209
-
210
-
211
-
212
-
213
-
214
-
215
-
216
-
217
-
218
-
219
-
220
-
221
-
222
-
223
-
224
-
225
-
226
-
227
-
228
-
229
-
230
-
231
-
232
-
233
-
234
-
235
-
236
-
237
-
238
-
239
-
240
-
241
-
242
-
243
-
244
-
245
-
246
-
247
-
248
-
249
-
250
-
251
-
252
-
253
-
254
-
255
-
256
-
257
-
258
-
259
-
260
-
261
-
262
-
263
-
264
-
265
-
266
-
267
-
268
-
269
-
270
 |
 |

114
3
GROUP MANAGEMENT REPORT – FINANCIAL REVIEW
Group Business Performance – Income Statement
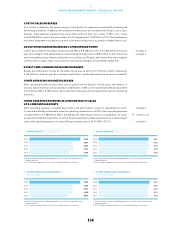
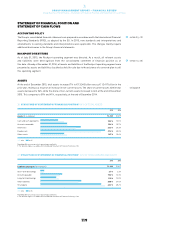
COSTOF SALES INCREASES
Cost of sales is defined as the amount we pay to third parties for expenses associated with producing and
delivering our products. In addition, own-production expenses are also included in the Group’s cost of sales.
However, these expenses represent only a very small portion of total cost of sales. In 2015, cost of sales
was € 8.748 billion, representing an increase of 15% compared to € 7.610 billion in 2014. This development
was due to the growth of our business as well as increases in input costs as a result of higher labour costs.
GROUP GROSS MARGIN INCREASES 0.6 PERCENTAGE POINTS
In 2015, gross profit for the adidas Group increased 18% to € 8.168 billion versus € 6.924 billion in the prior
year. Gross margin of the adidas Group increased 0.6 percentage points to 48.3% (2014: 47.6%), driven by a
more favourable pricing, channel and product mix at adidas and Reebok, which more than offset negative
currency effects, higher input costs as well as lower product margins at TaylorMade-adidas Golf.
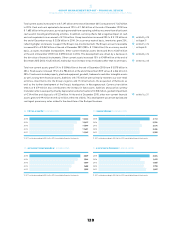
ROYALTYAND COMMISSION INCOME INCREASES
Royalty and commission income for the adidas Group was up 16% to € 119 million in 2015 compared to
€ 102 million in the prior year. On a currency-neutral basis, royalty and commission income increased 2%.
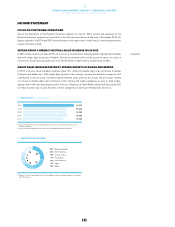
OTHER OPERATING INCOME DECREASES
Other operating income includes items such as gains from the disposal of fixed assets and releases of
accruals and provisions as well as insurance compensation. In 2015, other operating income decreased 30%
to € 96 million (2014: € 138 million), due to a decline in the release of other operational and non-operational
provisions.
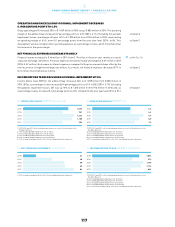
OTHER OPERATING EXPENSESASA PERCENTAGE OF SALES
UP 0.4 PERCENTAGE POINTS
Other operating expenses, including depreciation and amortisation, consist of expenditure for point-
of-sale and marketing investments as well as operating overhead costs. In 2015, other operating expenses
increased 18% to € 7.289 billion (2014: € 6.203 billion), reflecting an increase in expenditure for point-
of-sale and marketing investments as well as higher operating overhead expenditure. As a percentage of
sales, other operating expenses increased 0.4 percentage points to 43.1% (2014: 42.7%).
see Diagram 13
see Diagram 14
see Diagram 15
see Note 31, p. 235
see Diagram 16
13GROSS PROFIT 1, 2€ IN MILLIONS
2015 8,168
2014 6,924
2013 7,001
2012 7,103
2011 6,329
1 2015, 2014 and 2013 reflect continuing operations as a result of the divestiture of the
Rockport business.
2 2011 restated according to IAS 8 in the 2012 consolidated financial statements.
14GROSS MARGIN 1, 2IN %
2015 48.3
2014 47.6
2013 49.3
2012 47.7
2011 47.5
1 2015, 2014 and 2013 reflect continuing operations as a result of the divestiture of the
Rockport business.
2 2011 restated according to IAS 8 in the 2012 consolidated financial statements.
15 OTHER OPERATING EXPENSES 1, 2
€ IN MILLIONS
2015 7,289
2014 6,203
2013 6,013
2012 6,150
2011 5,567
1 2015, 2014 and 2013 reflect continuing operations as a result of the divestiture of the
Rockport business.
2 2011 restated according to IAS 8 in the 2012 consolidated financial statements.
16 OTHER OPERATING EXPENSES 1, 2
IN % OF NETSALES
2015 43.1
2014 42.7
2013 42.3
2012 41.3
2011 41.8
1 2015, 2014 and 2013 reflect continuing operations as a result of the divestiture of the
Rockport business.
2 2011 restated according to IAS 8 in the 2012 consolidated financial statements.