Reebok 2015 Annual Report Download - page 126
Download and view the complete annual report
Please find page 126 of the 2015 Reebok annual report below. You can navigate through the pages in the report by either clicking on the pages listed below, or by using the keyword search tool below to find specific information within the annual report.-
 1
1 -
2
-
3
-
4
-
5
-
6
-
7
-
8
-
9
-
10
-
11
-
12
-
13
-
14
-
15
-
16
-
17
-
18
-
19
-
20
-
21
-
22
-
23
-
24
-
25
-
26
-
27
-
28
-
29
-
30
-
31
-
32
-
33
-
34
-
35
-
36
-
37
-
38
-
39
-
40
-
41
-
42
-
43
-
44
-
45
-
46
-
47
-
48
-
49
-
50
-
51
-
52
-
53
-
54
-
55
-
56
-
57
-
58
-
59
-
60
-
61
-
62
-
63
-
64
-
65
-
66
-
67
-
68
-
69
-
70
-
71
-
72
-
73
-
74
-
75
-
76
-
77
-
78
-
79
-
80
-
81
-
82
-
83
-
84
-
85
-
86
-
87
-
88
-
89
-
90
-
91
-
92
-
93
-
94
-
95
-
96
-
97
-
98
-
99
-
100
-
101
-
102
-
103
-
104
-
105
-
106
-
107
-
108
-
109
-
110
-
111
-
112
-
113
-
114
-
115
-
 116
116 -
 117
117 -
 118
118 -
 119
119 -
 120
120 -
 121
121 -
 122
122 -
 123
123 -
 124
124 -
 125
125 -
 126
126 -
 127
127 -
 128
128 -
 129
129 -
 130
130 -
 131
131 -
 132
132 -
 133
133 -
 134
134 -
 135
135 -
 136
136 -
137
-
138
-
139
-
140
-
141
-
142
-
143
-
144
-
145
-
146
-
147
-
148
-
149
-
150
-
151
-
152
-
153
-
154
-
155
-
156
-
157
-
158
-
159
-
160
-
161
-
162
-
163
-
164
-
165
-
166
-
167
-
168
-
169
-
170
-
171
-
172
-
173
-
174
-
175
-
176
-
177
-
178
-
179
-
180
-
181
-
182
-
183
-
184
-
185
-
186
-
187
-
188
-
189
-
190
-
191
-
192
-
193
-
194
-
195
-
196
-
197
-
198
-
199
-
200
-
201
-
202
-
203
-
204
-
205
-
206
-
207
-
208
-
209
-
210
-
211
-
212
-
213
-
214
-
215
-
216
-
217
-
218
-
219
-
220
-
221
-
222
-
223
-
224
-
225
-
226
-
227
-
228
-
229
-
230
-
231
-
232
-
233
-
234
-
235
-
236
-
237
-
238
-
239
-
240
-
241
-
242
-
243
-
244
-
245
-
246
-
247
-
248
-
249
-
250
-
251
-
252
-
253
-
254
-
255
-
256
-
257
-
258
-
259
-
260
-
261
-
262
-
263
-
264
-
265
-
266
-
267
-
268
-
269
-
270
 |
 |
122
3
GROUP MANAGEMENT REPORT – FINANCIAL REVIEW
Group Business Performance – Statement of Financial Position and Statement of Cash Flows
INVESTMENTANALYSIS
Capital expenditure is defined as the total cash expenditure for the purchase of tangible and intangible
assets (excluding acquisitions). Group capital expenditure decreased 7% to € 513 million in 2015 (2014:
€ 554 million). Capital expenditure in property, plant and equipment amounted to € 464 million and was
thus below the prior year level of € 504 million. The Group invested € 49 million in intangible assets,
representing a 2% decrease compared to the prior year (2014: € 50 million). Depreciation and amortisation
excluding impairment losses/reversal of impairment losses of tangible and intangible assets increased
10% to € 338 million in 2015 (2014: € 309 million).
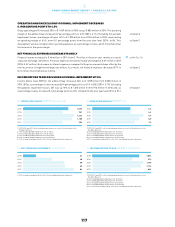
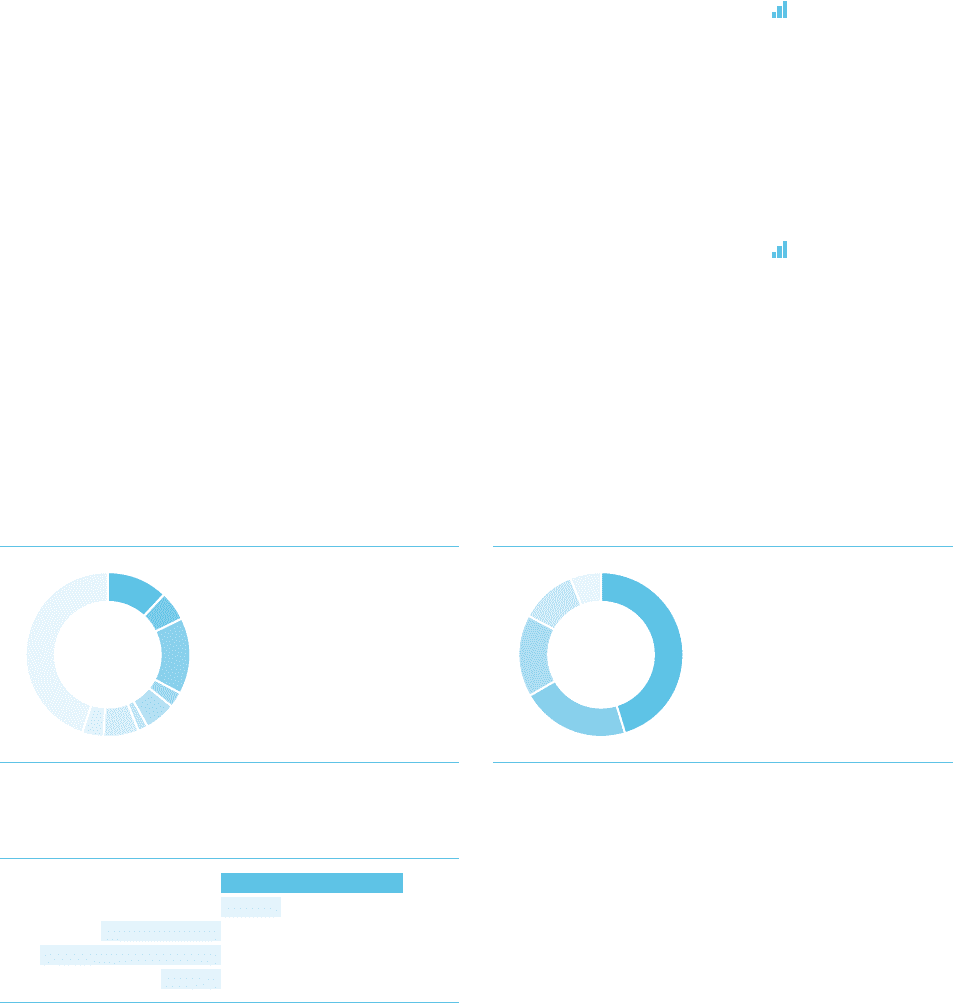
The majority of the Group’s capital expenditure was related to the Group’s controlled space initiatives.
Investments in new or remodelled own-retail and franchise stores as well as in shop-in-shop presentations
of our brands and products in our customers’ stores accounted for 45% of total capital expenditure
(2014: 36%). Expenditure for logistics and IT represented 21% and 11%, respectively (2014: 33% and 9%,
respectively). In addition, expenditure for administration represented 6% (2014: 7%), while 16% of total
capital expenditure was recorded for other initiatives (2014: 14%). From a regional perspective, the majority
of the Group’s capital expenditure was recorded at the Group’s headquarters in Herzogenaurach, Germany,
accounting for 45% (2014: 55%). In addition, capital expenditure in Greater China accounted for 15% (2014:
10%) of the Group’s capital expenditure, followed by Western Europe with 12% (2014: 6%), MEAA with 7%
(2014: 6%), North America and Latin America with 6% each (2014: 6% and 6%, respectively), Russia/CIS
with 3% (2014: 5%) and Japan with 2% (2014: 1%). Expenditure for Other Businesses accounted for 4% of
total capital expenditure (2014: 4%).
LIQUIDITYANALYSIS
In 2015, net cash generated from operating activities increased to € 1.090 billion (2014: € 701 million).
Net cash generated from continuing operating activities increased to € 1.086 billion (2014: € 694 million),
driven by a significant increase in income before taxes, partly offset by an increase in income taxes paid.
Net cash used in investing activities increased to € 591 million (2014: € 537 million). Net cash used in
continuing investing activities increased to € 584 million (2014: € 531 million), mainly as a result of the
see Diagram 35
see Diagram 34
34CAPITAL EXPENDITURE BY REGION
12%
6%
15%
3%
6%
2%
7%
4%
45%
Western Europe
North America
Greater China
Russia/CIS
Latin America
Japan
MEAA
Other Businesses
HQ/Consolidation
45
3
6
7
42
12 6
15
35CAPITAL EXPENDITURE BY TYPE
45%
21%
16%
11%
6%
Controlled space
Logistics
Other
IT
Administration
6
11
16
21
45
36NET BORROWINGS/EBITDA 1€ IN MILLIONS
2015 0.3
2014 0.1
2013 (0.2)
2012 (0.3)
2011 (0.1)
1 2015, 2014 and 2013 reflect continuing operations as a result of the divestiture of the
Rockport business.