Reebok 2015 Annual Report Download - page 127
Download and view the complete annual report
Please find page 127 of the 2015 Reebok annual report below. You can navigate through the pages in the report by either clicking on the pages listed below, or by using the keyword search tool below to find specific information within the annual report.-
 1
1 -
2
-
3
-
4
-
5
-
6
-
7
-
8
-
9
-
10
-
11
-
12
-
13
-
14
-
15
-
16
-
17
-
18
-
19
-
20
-
21
-
22
-
23
-
24
-
25
-
26
-
27
-
28
-
29
-
30
-
31
-
32
-
33
-
34
-
35
-
36
-
37
-
38
-
39
-
40
-
41
-
42
-
43
-
44
-
45
-
46
-
47
-
48
-
49
-
50
-
51
-
52
-
53
-
54
-
55
-
56
-
57
-
58
-
59
-
60
-
61
-
62
-
63
-
64
-
65
-
66
-
67
-
68
-
69
-
70
-
71
-
72
-
73
-
74
-
75
-
76
-
77
-
78
-
79
-
80
-
81
-
82
-
83
-
84
-
85
-
86
-
87
-
88
-
89
-
90
-
91
-
92
-
93
-
94
-
95
-
96
-
97
-
98
-
99
-
100
-
101
-
102
-
103
-
104
-
105
-
106
-
107
-
108
-
109
-
110
-
111
-
112
-
113
-
114
-
115
-
116
-
 117
117 -
 118
118 -
 119
119 -
 120
120 -
 121
121 -
 122
122 -
 123
123 -
 124
124 -
 125
125 -
 126
126 -
 127
127 -
 128
128 -
 129
129 -
 130
130 -
 131
131 -
 132
132 -
 133
133 -
 134
134 -
 135
135 -
 136
136 -
 137
137 -
138
-
139
-
140
-
141
-
142
-
143
-
144
-
145
-
146
-
147
-
148
-
149
-
150
-
151
-
152
-
153
-
154
-
155
-
156
-
157
-
158
-
159
-
160
-
161
-
162
-
163
-
164
-
165
-
166
-
167
-
168
-
169
-
170
-
171
-
172
-
173
-
174
-
175
-
176
-
177
-
178
-
179
-
180
-
181
-
182
-
183
-
184
-
185
-
186
-
187
-
188
-
189
-
190
-
191
-
192
-
193
-
194
-
195
-
196
-
197
-
198
-
199
-
200
-
201
-
202
-
203
-
204
-
205
-
206
-
207
-
208
-
209
-
210
-
211
-
212
-
213
-
214
-
215
-
216
-
217
-
218
-
219
-
220
-
221
-
222
-
223
-
224
-
225
-
226
-
227
-
228
-
229
-
230
-
231
-
232
-
233
-
234
-
235
-
236
-
237
-
238
-
239
-
240
-
241
-
242
-
243
-
244
-
245
-
246
-
247
-
248
-
249
-
250
-
251
-
252
-
253
-
254
-
255
-
256
-
257
-
258
-
259
-
260
-
261
-
262
-
263
-
264
-
265
-
266
-
267
-
268
-
269
-
270
 |
 |

123
3
GROUP MANAGEMENT REPORT – FINANCIAL REVIEW
Group Business Performance – Statement of Financial Position and Statement of Cash Flows
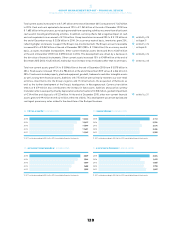
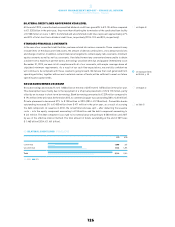
acquisition of Runtastic, partly offset by proceeds from the divestiture of the Rockport business and lower
purchases of property, plant and equipment. The majority of investing activities in 2015 related to spending
for property, plant and equipment, such as investments in the furnishing and fitting of our own-retail
stores, investments in the Group’s logistics infrastructure and IT systems. Net cash used in financing
activities totalled € 691 million (2014: € 118 million), mainly related to the dividend paid to shareholders
of € 303 million as well as the repurchase of treasury shares in the amount of € 301 million. Exchange
rate effects negatively impacted the Group’s cash position by € 126 million in 2015 (2014: positive impact of
€ 50 million). As a result of all these developments, cash and cash equivalents decreased by € 318 million
to € 1.365 billion at the end of December 2015 compared to € 1.683 billion at the end of December 2014. Net
borrowings at December 31, 2015 amounted to € 460 million, compared to net borrowings of € 185 million
in 2014, representing an increase of € 275 million. This development is mainly a result of the utilisation of
cash for the share buyback programme in an amount of € 301 million. The Group’s ratio of net borrowings
over EBITDA amounted to 0.3 at the end of December 2015 (2014: 0.1).
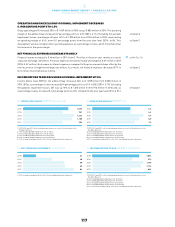
Operating cash flow, as described in the Internal Group Management System, increased 17% to € 620 million
in 2015 from € 530 million in 2014, mainly due to a higher operating profit.
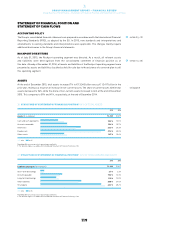
OFF-BALANCE SHEET ITEMS
The Group’s most significant off-balance sheet items are commitments for promotion and advertising
as well as operating leases, which are related to own-retail stores, offices, warehouses and equipment.
The Group has entered into various operating leases as opposed to property acquisitions in order to
reduce exposure to property value fluctuations. Minimum future lease payments for operating leases were
€ 2.199 billion at December 31, 2015, compared to € 1.711 billion at the end of December 2014, representing
an increase of 29%. At the end of December 2015, financial commitments for promotion and advertising
increased 11% to € 5.779 billion in 2015 (2014: € 5.193 billion).
see Glossary, p. 260
see Diagram 37
see Diagram 36
see Treasury, p. 124
see Internal Group
Management System, p. 102
see Note 38, p. 245
see Note 28, p. 226
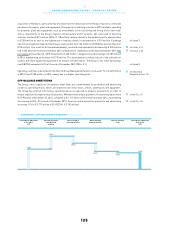
37CHANGE IN CASH AND CASH EQUIVALENTS€ IN MILLIONS
Cash and cash equivalents
at the end of
2014
Net cash generated
from operating
activities
Net cash used in
investing activities
Net cash used in
financing activities
Effect of exchange
rates
Cash and cash equivalents
at the end of
2015
1,683
1,090
(591)
(691) (126)
1,365