Reebok 2015 Annual Report Download - page 205
Download and view the complete annual report
Please find page 205 of the 2015 Reebok annual report below. You can navigate through the pages in the report by either clicking on the pages listed below, or by using the keyword search tool below to find specific information within the annual report.-
 1
1 -
2
-
3
-
4
-
5
-
6
-
7
-
8
-
9
-
10
-
11
-
12
-
13
-
14
-
15
-
16
-
17
-
18
-
19
-
20
-
21
-
22
-
23
-
24
-
25
-
26
-
27
-
28
-
29
-
30
-
31
-
32
-
33
-
34
-
35
-
36
-
37
-
38
-
39
-
40
-
41
-
42
-
43
-
44
-
45
-
46
-
47
-
48
-
49
-
50
-
51
-
52
-
53
-
54
-
55
-
56
-
57
-
58
-
59
-
60
-
61
-
62
-
63
-
64
-
65
-
66
-
67
-
68
-
69
-
70
-
71
-
72
-
73
-
74
-
75
-
76
-
77
-
78
-
79
-
80
-
81
-
82
-
83
-
84
-
85
-
86
-
87
-
88
-
89
-
90
-
91
-
92
-
93
-
94
-
95
-
96
-
97
-
98
-
99
-
100
-
101
-
102
-
103
-
104
-
105
-
106
-
107
-
108
-
109
-
110
-
111
-
112
-
113
-
114
-
115
-
116
-
117
-
118
-
119
-
120
-
121
-
122
-
123
-
124
-
125
-
126
-
127
-
128
-
129
-
130
-
131
-
132
-
133
-
134
-
135
-
136
-
137
-
138
-
139
-
140
-
141
-
142
-
143
-
144
-
145
-
146
-
147
-
148
-
149
-
150
-
151
-
152
-
153
-
154
-
155
-
156
-
157
-
158
-
159
-
160
-
161
-
162
-
163
-
164
-
165
-
166
-
167
-
168
-
169
-
170
-
171
-
172
-
173
-
174
-
175
-
176
-
177
-
178
-
179
-
180
-
181
-
182
-
183
-
184
-
185
-
186
-
187
-
188
-
189
-
190
-
191
-
192
-
193
-
194
-
 195
195 -
 196
196 -
 197
197 -
 198
198 -
 199
199 -
 200
200 -
 201
201 -
 202
202 -
 203
203 -
 204
204 -
 205
205 -
 206
206 -
 207
207 -
 208
208 -
 209
209 -
 210
210 -
 211
211 -
 212
212 -
 213
213 -
 214
214 -
 215
215 -
216
-
217
-
218
-
219
-
220
-
221
-
222
-
223
-
224
-
225
-
226
-
227
-
228
-
229
-
230
-
231
-
232
-
233
-
234
-
235
-
236
-
237
-
238
-
239
-
240
-
241
-
242
-
243
-
244
-
245
-
246
-
247
-
248
-
249
-
250
-
251
-
252
-
253
-
254
-
255
-
256
-
257
-
258
-
259
-
260
-
261
-
262
-
263
-
264
-
265
-
266
-
267
-
268
-
269
-
270
 |
 |

CONSOLIDATED FINANCIAL STATEMENTS
Notes
201
4
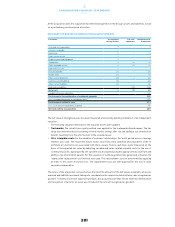
At the acquisition date, the acquisition had the following effect on the Group’s assets and liabilities, based
on a preliminary purchase price allocation:
NETASSETS OF RUNTASTIC GMBH AT THE ACQUISITION DATE
€ in millions Pre-acquisition
carrying amounts
Fair value
adjustments
Recognised values
on acquisition
Cash and cash equivalents 7 – 7
Accounts receivable 2 – 2
Inventories 0 – 0
Other current assets 1 – 1
Property, plant and equipment 1 – 1
Trademarks 0 31 31
Other intangible assets 0 21 21
Deferred tax assets 1 – 1
Accounts payable (1) – (1)
Income taxes (1) – (1)
Other current provisions (1) – (1)
Current accrued liabilities (3) – (3)
Other current liabilities (2) – (2)
Deferred tax liabilities – (13) (13)
Net assets 339 42
Goodwill arising on acquisition 192
Purchase price in consideration of contingent payments 235
Less: contingent payments in subsequent years (21)
Purchase price settled in cash 213
Less: cash and cash equivalents acquired (7)
Net cash outflow on acquisition 207
The fair value of intangible assets has been measured provisionally pending completion of an independent
valuation.
The following valuation methods for the acquired assets were applied:
•Trademarks: The ‘relief-from-royalty method’ was applied for the trademarks/brand names. The fair
value was determined by discounting notional royalty savings after tax and adding a tax amortisation
benefit, resulting from the amortisation of the acquired asset.
•
Other intangible assets: For the valuation of customer relationships, the ‘multi-period-excess-earnings
method’ was used. The respective future excess cash flows were identified and adjusted in order to
eliminate all elements not associated with these assets. Future cash flows were measured on the
basis of the expected net sales by deducting variable and sales-related imputed costs for the use of
contributory assets. Subsequently, the outcome was discounted using the appropriate discount rate and
adding a tax amortisation benefit. For the valuation of technology (internally generated software), the
‘depreciated-replacement-cost method’ was used. The replacement costs are determined by applying
an index to the asset’s historical cost. The replacement costs are then adjusted for the loss in value
caused by depreciation.
The excess of the acquisition cost paid versus the net of the amounts of the fair values assigned to all assets
acquired and liabilities assumed, taking into consideration the respective deferred taxes, was recognised as
goodwill. It mainly arose from expected synergies. Any acquired asset that did not meet the identification
and recognition criteria for an asset was included in the amount recognised as goodwill.