Reebok 2015 Annual Report Download - page 124
Download and view the complete annual report
Please find page 124 of the 2015 Reebok annual report below. You can navigate through the pages in the report by either clicking on the pages listed below, or by using the keyword search tool below to find specific information within the annual report.-
 1
1 -
2
-
3
-
4
-
5
-
6
-
7
-
8
-
9
-
10
-
11
-
12
-
13
-
14
-
15
-
16
-
17
-
18
-
19
-
20
-
21
-
22
-
23
-
24
-
25
-
26
-
27
-
28
-
29
-
30
-
31
-
32
-
33
-
34
-
35
-
36
-
37
-
38
-
39
-
40
-
41
-
42
-
43
-
44
-
45
-
46
-
47
-
48
-
49
-
50
-
51
-
52
-
53
-
54
-
55
-
56
-
57
-
58
-
59
-
60
-
61
-
62
-
63
-
64
-
65
-
66
-
67
-
68
-
69
-
70
-
71
-
72
-
73
-
74
-
75
-
76
-
77
-
78
-
79
-
80
-
81
-
82
-
83
-
84
-
85
-
86
-
87
-
88
-
89
-
90
-
91
-
92
-
93
-
94
-
95
-
96
-
97
-
98
-
99
-
100
-
101
-
102
-
103
-
104
-
105
-
106
-
107
-
108
-
109
-
110
-
111
-
112
-
113
-
 114
114 -
 115
115 -
 116
116 -
 117
117 -
 118
118 -
 119
119 -
 120
120 -
 121
121 -
 122
122 -
 123
123 -
 124
124 -
 125
125 -
 126
126 -
 127
127 -
 128
128 -
 129
129 -
 130
130 -
 131
131 -
 132
132 -
 133
133 -
 134
134 -
135
-
136
-
137
-
138
-
139
-
140
-
141
-
142
-
143
-
144
-
145
-
146
-
147
-
148
-
149
-
150
-
151
-
152
-
153
-
154
-
155
-
156
-
157
-
158
-
159
-
160
-
161
-
162
-
163
-
164
-
165
-
166
-
167
-
168
-
169
-
170
-
171
-
172
-
173
-
174
-
175
-
176
-
177
-
178
-
179
-
180
-
181
-
182
-
183
-
184
-
185
-
186
-
187
-
188
-
189
-
190
-
191
-
192
-
193
-
194
-
195
-
196
-
197
-
198
-
199
-
200
-
201
-
202
-
203
-
204
-
205
-
206
-
207
-
208
-
209
-
210
-
211
-
212
-
213
-
214
-
215
-
216
-
217
-
218
-
219
-
220
-
221
-
222
-
223
-
224
-
225
-
226
-
227
-
228
-
229
-
230
-
231
-
232
-
233
-
234
-
235
-
236
-
237
-
238
-
239
-
240
-
241
-
242
-
243
-
244
-
245
-
246
-
247
-
248
-
249
-
250
-
251
-
252
-
253
-
254
-
255
-
256
-
257
-
258
-
259
-
260
-
261
-
262
-
263
-
264
-
265
-
266
-
267
-
268
-
269
-
270
 |
 |

120
3
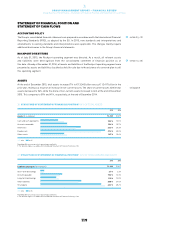
GROUP MANAGEMENT REPORT – FINANCIAL REVIEW
Group Business Performance – Statement of Financial Position and Statement of Cash Flows
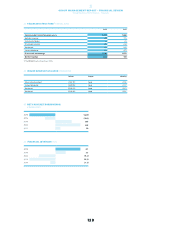
Total current assets increased 2% to € 7.497 billion at the end of December 2015 compared to € 7.347 billion
in 2014. Cash and cash equivalents decreased 19% to € 1.365 billion at the end of December 2015 from
€ 1.683 billion in the prior year, as net cash generated from operating activities was more than offset by net
cash used in investing and financing activities. In addition, currency effects had a negative impact on cash
and cash equivalents in an amount of € 126 million. Group inventories increased 23% to € 3.113 billion at
the end of December versus € 2.526 billion in 2014. On a currency-neutral basis, inventories grew 25%,
reflecting higher stock levels to support the Group’s top-line momentum. The Group’s accounts receivable
increased 5% to € 2.049 billion at the end of December 2015 (2014: € 1.946 billion). On a currency-neutral
basis, accounts receivable increased 3%. Other current financial assets decreased 8% to € 367 million
at the end of December 2015 from € 398 million in 2014. This development was driven by a decrease in
the fair value of financial instruments. Other current assets increased 15% to € 489 million at the end of
December 2015 (2014: € 425 million), mainly due to an increase in tax receivables other than income taxes.
Total non-current assets grew 15% to € 5.846 billion at the end of December 2015 from € 5.070 billion in
2014. Fixed assets increased 15% to € 4.986 billion at the end of December 2015 versus € 4.346 billion in
2014. Fixed assets include property, plant and equipment, goodwill, trademarks and other intangible assets
as well as long-term financial assets. Additions of € 775 million were primarily related to our own-retail
activities, investments into the Group’s logistics and IT infrastructure, the acquisition of Runtastic as
well as the further development of the Group’s headquarters in Herzogenaurach. Currency translation
effects of € 279 million also contributed to the increase in fixed assets. Additions and positive currency
translation effects were partly offset by depreciation and amortisation of € 358 million, goodwill impairment
of € 34 million and disposals of € 22 million. At the end of December 2015, other non-current financial
assets grew to € 99 million from € 42 million at the end of 2014. This development was driven by fixed and
contingent promissory notes related to the divestiture of the Rockport business.
see Diagram 29
see Diagram 30
see Note 09, p. 205
see Note 07, p. 204
see Note 08, p. 204
see Note 10, p. 205
see Note 16, p. 211
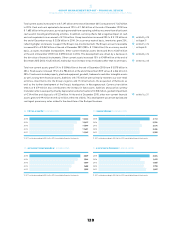
28TOTAL ASSETS 1€ IN MILLIONS
2015 13,343
2014 12,417
2013 11,599
2012 11,651
2011 11,237
1 2011 restated according to IAS 8 in the 2012 consolidated financial statements.
29INVENTORIES 1€ IN MILLIONS
2015 3,113
2014 2,526
2013 2,634
2012 2,486
2011 2,502
1 2011 restated according to IAS 8 in the 2012 consolidated financial statements.
30ACCOUNTS RECEIVABLE 1€ IN MILLIONS
2015 2,049
2014 1,946
2013 1,809
2012 1,688
2011 1,595
1 2011 restated according to IAS 8 in the 2012 consolidated financial statements.
31ACCOUNTS PAYABLE 1€ IN MILLIONS
2015 2,024
2014 1,652
2013 1,825
2012 1,790
2011 1,887
1 2011 restated according to IAS 8 in the 2012 consolidated financial statements.