Reebok 2015 Annual Report Download - page 246
Download and view the complete annual report
Please find page 246 of the 2015 Reebok annual report below. You can navigate through the pages in the report by either clicking on the pages listed below, or by using the keyword search tool below to find specific information within the annual report.-
 1
1 -
2
-
3
-
4
-
5
-
6
-
7
-
8
-
9
-
10
-
11
-
12
-
13
-
14
-
15
-
16
-
17
-
18
-
19
-
20
-
21
-
22
-
23
-
24
-
25
-
26
-
27
-
28
-
29
-
30
-
31
-
32
-
33
-
34
-
35
-
36
-
37
-
38
-
39
-
40
-
41
-
42
-
43
-
44
-
45
-
46
-
47
-
48
-
49
-
50
-
51
-
52
-
53
-
54
-
55
-
56
-
57
-
58
-
59
-
60
-
61
-
62
-
63
-
64
-
65
-
66
-
67
-
68
-
69
-
70
-
71
-
72
-
73
-
74
-
75
-
76
-
77
-
78
-
79
-
80
-
81
-
82
-
83
-
84
-
85
-
86
-
87
-
88
-
89
-
90
-
91
-
92
-
93
-
94
-
95
-
96
-
97
-
98
-
99
-
100
-
101
-
102
-
103
-
104
-
105
-
106
-
107
-
108
-
109
-
110
-
111
-
112
-
113
-
114
-
115
-
116
-
117
-
118
-
119
-
120
-
121
-
122
-
123
-
124
-
125
-
126
-
127
-
128
-
129
-
130
-
131
-
132
-
133
-
134
-
135
-
136
-
137
-
138
-
139
-
140
-
141
-
142
-
143
-
144
-
145
-
146
-
147
-
148
-
149
-
150
-
151
-
152
-
153
-
154
-
155
-
156
-
157
-
158
-
159
-
160
-
161
-
162
-
163
-
164
-
165
-
166
-
167
-
168
-
169
-
170
-
171
-
172
-
173
-
174
-
175
-
176
-
177
-
178
-
179
-
180
-
181
-
182
-
183
-
184
-
185
-
186
-
187
-
188
-
189
-
190
-
191
-
192
-
193
-
194
-
195
-
196
-
197
-
198
-
199
-
200
-
201
-
202
-
203
-
204
-
205
-
206
-
207
-
208
-
209
-
210
-
211
-
212
-
213
-
214
-
215
-
216
-
217
-
218
-
219
-
220
-
221
-
222
-
223
-
224
-
225
-
226
-
227
-
228
-
229
-
230
-
231
-
232
-
233
-
234
-
235
-
 236
236 -
 237
237 -
 238
238 -
 239
239 -
 240
240 -
 241
241 -
 242
242 -
 243
243 -
 244
244 -
 245
245 -
 246
246 -
 247
247 -
 248
248 -
 249
249 -
 250
250 -
 251
251 -
 252
252 -
 253
253 -
 254
254 -
 255
255 -
 256
256 -
257
-
258
-
259
-
260
-
261
-
262
-
263
-
264
-
265
-
266
-
267
-
268
-
269
-
270
 |
 |

242
4
CONSOLIDATED FINANCIAL STATEMENTS
Notes – Additional Information
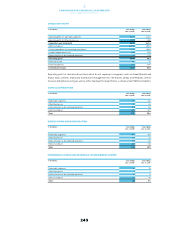
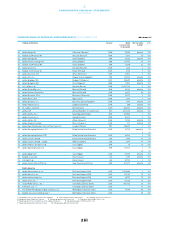
SEGMENTAL INFORMATION I
€ in millions Net sales (non-Group) 1Segmental operating profit 1Segmental assets 2Segmental liabilities 2
2015 2014 2015 2014 2015 2014 2015 2014
Western Europe 4,539 3,793 909 666 1,327 1,013 145 122
North America 2,753 2,217 69 120 891 744 96 47
Greater China 2,469 1,786 866 617 465 335 146 109
Russia/CIS 739 1,098 85 173 204 226 6 17
Latin America 1,783 1,612 235 199 619 629 63 91
Japan 776 744 147 121 233 243 34 75
MEAA 2,388 1,925 664 555 633 553 77 67
Other Businesses (continuing operations) 1,467 1,358 (89) (57) 684 709 117 134
Other Businesses (discontinued operations) 159 283 (18) 19 0 139 0 37
Other Businesses (total) 1,627 1,641 (107) (38) 684 848 117 171
Total 17,075 14,817 2,869 2,413 5,056 4,591 683 699
1 Year ending December 31.
2 At December 31.
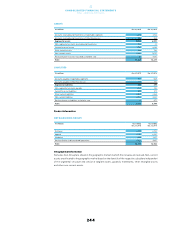
SEGMENTAL INFORMATION II
€ in millions Capital expenditure 1Depreciation and
amortisation 1
Impairment losses
and reversals of
impairment losses 1
2015 2014 2015 2014 2015 2014
Western Europe 63 35 33 27 4 5
North America 32 32 21 18 7 6
Greater China 76 56 43 34 1 (0)
Russia/CIS 16 29 24 39 2 4
Latin America 30 35 22 22 2 –
Japan 13 8 10 9 0 0
MEAA 35 31 27 20 1 (0)
Other Businesses (continuing operations) 18 20 20 17 1 1
Other Businesses (discontinued operations) 4 6 4 7 (0) (0)
Other Businesses (total) 22 26 24 23 1 1
Total 287 253 204 191 18 16
1 Year ending December 31.
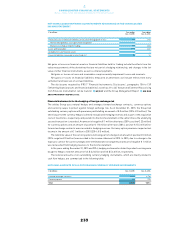
Reconciliations
The following tables include reconciliations of segmental information to the aggregate numbers of the
consolidated financial statements, taking into account items which are not directly attributable to a segment
or a group of segments.
NETSALES NON-GROUP
€ in millions Year ending
Dec. 31, 2015
Year ending
Dec. 31, 2014
Reportable segments 15,448 13,176
Other Businesses 1,627 1,641
Reclassification to discontinued operations (159) (283)
Total 16,915 14,534