Reebok 2015 Annual Report Download - page 137
Download and view the complete annual report
Please find page 137 of the 2015 Reebok annual report below. You can navigate through the pages in the report by either clicking on the pages listed below, or by using the keyword search tool below to find specific information within the annual report.-
 1
1 -
2
-
3
-
4
-
5
-
6
-
7
-
8
-
9
-
10
-
11
-
12
-
13
-
14
-
15
-
16
-
17
-
18
-
19
-
20
-
21
-
22
-
23
-
24
-
25
-
26
-
27
-
28
-
29
-
30
-
31
-
32
-
33
-
34
-
35
-
36
-
37
-
38
-
39
-
40
-
41
-
42
-
43
-
44
-
45
-
46
-
47
-
48
-
49
-
50
-
51
-
52
-
53
-
54
-
55
-
56
-
57
-
58
-
59
-
60
-
61
-
62
-
63
-
64
-
65
-
66
-
67
-
68
-
69
-
70
-
71
-
72
-
73
-
74
-
75
-
76
-
77
-
78
-
79
-
80
-
81
-
82
-
83
-
84
-
85
-
86
-
87
-
88
-
89
-
90
-
91
-
92
-
93
-
94
-
95
-
96
-
97
-
98
-
99
-
100
-
101
-
102
-
103
-
104
-
105
-
106
-
107
-
108
-
109
-
110
-
111
-
112
-
113
-
114
-
115
-
116
-
117
-
118
-
119
-
120
-
121
-
122
-
123
-
124
-
125
-
126
-
 127
127 -
 128
128 -
 129
129 -
 130
130 -
 131
131 -
 132
132 -
 133
133 -
 134
134 -
 135
135 -
 136
136 -
 137
137 -
 138
138 -
 139
139 -
 140
140 -
 141
141 -
 142
142 -
 143
143 -
 144
144 -
 145
145 -
 146
146 -
 147
147 -
148
-
149
-
150
-
151
-
152
-
153
-
154
-
155
-
156
-
157
-
158
-
159
-
160
-
161
-
162
-
163
-
164
-
165
-
166
-
167
-
168
-
169
-
170
-
171
-
172
-
173
-
174
-
175
-
176
-
177
-
178
-
179
-
180
-
181
-
182
-
183
-
184
-
185
-
186
-
187
-
188
-
189
-
190
-
191
-
192
-
193
-
194
-
195
-
196
-
197
-
198
-
199
-
200
-
201
-
202
-
203
-
204
-
205
-
206
-
207
-
208
-
209
-
210
-
211
-
212
-
213
-
214
-
215
-
216
-
217
-
218
-
219
-
220
-
221
-
222
-
223
-
224
-
225
-
226
-
227
-
228
-
229
-
230
-
231
-
232
-
233
-
234
-
235
-
236
-
237
-
238
-
239
-
240
-
241
-
242
-
243
-
244
-
245
-
246
-
247
-
248
-
249
-
250
-
251
-
252
-
253
-
254
-
255
-
256
-
257
-
258
-
259
-
260
-
261
-
262
-
263
-
264
-
265
-
266
-
267
-
268
-
269
-
270
 |
 |

133
3
GROUP MANAGEMENT REPORT – FINANCIAL REVIEW
Group Business Performance – Financial Statements and Management Report of adidas AG
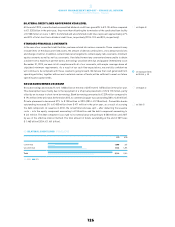
TOTAL ASSETS UP 1%
At the end of December 2015, total assets grew 1% to € 7.517 billion versus € 7.415 billion in the prior year.
The increase in financial assets was largely offset by the decrease in current assets.
SHAREHOLDERS’ EQUITY 2% ABOVE PRIOR YEAR
Shareholders’ equity increased 2% to € 2.087 billion at the end of December 2015 compared to € 2.051 billion
in the prior year. This increase was due to higher retained earnings which more than offset the negative
effect resulting from the buyback of treasury shares. The equity ratio remained stable at 28% (2014: 28%).
PROVISIONS INCREASE 14%
Provisions were up 14% to € 445 million at the end of 2015 from € 390 million in 2014. The increase primarily
resulted from higher pension provisions.
LIABILITIESAND OTHER ITEMS REMAIN STABLE
At the end of December 2015, liabilities and other items remained virtually unchanged at € 4.985 billion
versus the prior year (2014: € 4.974 billion).
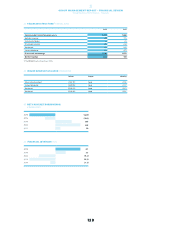
CASH INFLOW FROM OPERATINGACTIVITIES REFLECTS NET INCOME
adidas AG generated a positive cash flow from operating activities of € 1.076 billion (2014: € 61 million). The
change versus the prior year was mainly a result of higher net income and lower receivables from affiliated
companies. Net cash outflow from investment activities increased to € 830 million (2014: € 221 million). This
increase was largely attributable to capital expenditure for financial assets in an amount of € 781 million.
Financing activities resulted in a net cash outflow of € 733 million (2014: cash inflow of € 359 million).
The net cash outflow from financing activities mainly relates to the dividend payment in an amount of
€ 303 million and the buyback of treasury shares in an amount of € 300 million. As a result of all these
developments, cash and cash equivalents of adidas AG decreased to € 447 million at the end of December
2015 compared to € 934 million at the end of December 2014.
adidas AG has bilateral credit lines of € 1.7 billion. In addition, the company has a multi-currency commercial
paper programme in an amount of € 2.0 billion.
adidas AG is able to meet its financial commitments at all times.
see Table 50
see Table 50