Reebok 2015 Annual Report Download - page 262
Download and view the complete annual report
Please find page 262 of the 2015 Reebok annual report below. You can navigate through the pages in the report by either clicking on the pages listed below, or by using the keyword search tool below to find specific information within the annual report.-
 1
1 -
 2
2 -
 3
3 -
 4
4 -
 5
5 -
 6
6 -
 7
7 -
 8
8 -
 9
9 -
 10
10 -
 11
11 -
 12
12 -
 13
13 -
 14
14 -
 15
15 -
 16
16 -
 17
17 -
 18
18 -
 19
19 -
 20
20 -
 21
21 -
 22
22 -
 23
23 -
 24
24 -
 25
25 -
 26
26 -
 27
27 -
 28
28 -
 29
29 -
 30
30 -
 31
31 -
 32
32 -
 33
33 -
 34
34 -
 35
35 -
 36
36 -
 37
37 -
 38
38 -
 39
39 -
 40
40 -
 41
41 -
 42
42 -
 43
43 -
 44
44 -
 45
45 -
 46
46 -
 47
47 -
 48
48 -
 49
49 -
 50
50 -
 51
51 -
 52
52 -
 53
53 -
 54
54 -
 55
55 -
 56
56 -
 57
57 -
 58
58 -
 59
59 -
 60
60 -
 61
61 -
 62
62 -
 63
63 -
 64
64 -
 65
65 -
 66
66 -
 67
67 -
 68
68 -
 69
69 -
 70
70 -
 71
71 -
 72
72 -
 73
73 -
 74
74 -
 75
75 -
 76
76 -
 77
77 -
 78
78 -
 79
79 -
 80
80 -
 81
81 -
 82
82 -
 83
83 -
 84
84 -
 85
85 -
 86
86 -
 87
87 -
 88
88 -
 89
89 -
 90
90 -
 91
91 -
 92
92 -
 93
93 -
 94
94 -
 95
95 -
 96
96 -
 97
97 -
 98
98 -
 99
99 -
 100
100 -
 101
101 -
 102
102 -
 103
103 -
 104
104 -
 105
105 -
 106
106 -
 107
107 -
 108
108 -
 109
109 -
 110
110 -
 111
111 -
 112
112 -
 113
113 -
 114
114 -
 115
115 -
 116
116 -
 117
117 -
 118
118 -
 119
119 -
 120
120 -
 121
121 -
 122
122 -
 123
123 -
 124
124 -
 125
125 -
 126
126 -
 127
127 -
 128
128 -
 129
129 -
 130
130 -
 131
131 -
 132
132 -
 133
133 -
 134
134 -
 135
135 -
 136
136 -
 137
137 -
 138
138 -
 139
139 -
 140
140 -
 141
141 -
 142
142 -
 143
143 -
 144
144 -
 145
145 -
 146
146 -
 147
147 -
 148
148 -
 149
149 -
 150
150 -
 151
151 -
 152
152 -
 153
153 -
 154
154 -
 155
155 -
 156
156 -
 157
157 -
 158
158 -
 159
159 -
 160
160 -
 161
161 -
 162
162 -
 163
163 -
 164
164 -
 165
165 -
 166
166 -
 167
167 -
 168
168 -
 169
169 -
 170
170 -
 171
171 -
 172
172 -
 173
173 -
 174
174 -
 175
175 -
 176
176 -
 177
177 -
 178
178 -
 179
179 -
 180
180 -
 181
181 -
 182
182 -
 183
183 -
 184
184 -
 185
185 -
 186
186 -
 187
187 -
 188
188 -
 189
189 -
 190
190 -
 191
191 -
 192
192 -
 193
193 -
 194
194 -
 195
195 -
 196
196 -
 197
197 -
 198
198 -
 199
199 -
 200
200 -
 201
201 -
 202
202 -
 203
203 -
 204
204 -
 205
205 -
 206
206 -
 207
207 -
 208
208 -
 209
209 -
 210
210 -
 211
211 -
 212
212 -
 213
213 -
 214
214 -
 215
215 -
 216
216 -
 217
217 -
 218
218 -
 219
219 -
 220
220 -
 221
221 -
 222
222 -
 223
223 -
 224
224 -
 225
225 -
 226
226 -
 227
227 -
 228
228 -
 229
229 -
 230
230 -
 231
231 -
 232
232 -
 233
233 -
 234
234 -
 235
235 -
 236
236 -
 237
237 -
 238
238 -
 239
239 -
 240
240 -
 241
241 -
 242
242 -
 243
243 -
 244
244 -
 245
245 -
 246
246 -
 247
247 -
 248
248 -
 249
249 -
 250
250 -
 251
251 -
 252
252 -
 253
253 -
 254
254 -
 255
255 -
 256
256 -
 257
257 -
 258
258 -
 259
259 -
 260
260 -
 261
261 -
 262
262 -
 263
263 -
 264
264 -
 265
265 -
 266
266 -
 267
267 -
 268
268 -
 269
269 -
 270
270
 |
 |
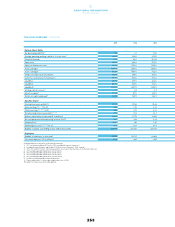
ADDITIONAL INFORMATION
Ten-Year Overview
258
5
Rounding differences may arise in percentages and totals.
1 2011 restated according to IAS 8 in the 2012 consolidated financial statements.
2 Including Reebok, Rockport and Reebok-CCM Hockey from February 1, 2006 onwards.
3 2015, 2014 and 2013 reflect continuing operations as a result of the divestiture of the Rockport business.
4 2015 excluding goodwill impairment of € 34 million.
5 2014 excluding goodwill impairment of € 78 million.
6 2013 excluding goodwill impairment of € 52 million.
7 2012 excluding goodwill impairment of € 265 million.
8 Includes continuing and discontinued operations.
9 Figures adjusted for 1:4 share split conducted on June 6, 2006.
10 Subject to Annual General Meeting approval.
TEN-YEAR OVERVIEWCONTINUED
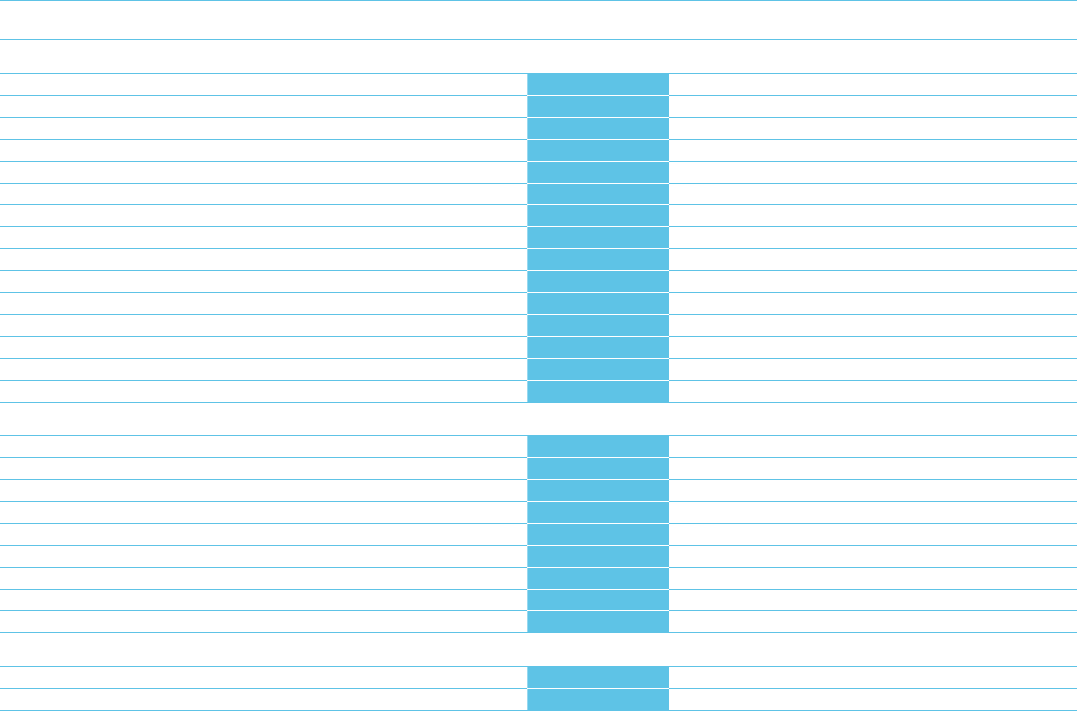
2015 2014 2013
Balance Sheet Ratios
Net borrowings/EBITDA 30.3 0.1 (0.2)
Average operating working capital in % of net sales 320.5% 22.4% 21.3%
Financial leverage 8.1% 3.3% (5.4%)
Equity ratio 42.5% 45.3% 47.3%
Equity-to-fixed-assets ratio 96.9% 110.9% 115.8%
Asset coverage I 136.8% 158.7% 145.0%
Asset coverage II 89.3% 105.9% 93.2%
Fixed asset intensity of investments 43.8% 40.8% 40.9%
Current asset intensity of investments 56.2% 59.2% 59.1%
Liquidity I 25.5% 38.6% 34.4%
Liquidity II 63.7% 83.0% 72.6%
Liquidity III 121.8% 140.7% 128.3%
Working capital turnover 37.9 4.9 6.7
Return on equity 811.2% 8.7% 14.3%
Return on capital employed 816.5% 13.8% 23.6%
Data Per Share 9
Share price at year-end (in €) 89.91 57.62 92.64
Basic earnings 4, 5, 6, 7, 8 (in €) 3.32 2.72 4.01
Diluted earnings 4, 5, 6, 7, 8 (in €) 3.32 2.72 4.01
Price/earnings ratio at year-end 4, 5, 6, 7, 8 27.1 21.2 23.1
Market capitalisation at year-end (€ in millions) 18,000 11,773 19,382
Net cash generated from operating activities (in €) 85.41 3.36 3.03
Dividend (in €) 1.60 10 1.50 1.50
Dividend payout ratio 4, 5, 6, 7, 8 (in %) 47.9 53.9 37.4
Number of shares outstanding at year-end (in thousands) 200,197 204,327 209,216
Employees
Number of employees at year-end 355,555 53,731 49,808
Personnel expenses 3 (€ in millions) 2,184 1,842 1,833
