Reebok 2015 Annual Report Download - page 119
Download and view the complete annual report
Please find page 119 of the 2015 Reebok annual report below. You can navigate through the pages in the report by either clicking on the pages listed below, or by using the keyword search tool below to find specific information within the annual report.-
 1
1 -
2
-
3
-
4
-
5
-
6
-
7
-
8
-
9
-
10
-
11
-
12
-
13
-
14
-
15
-
16
-
17
-
18
-
19
-
20
-
21
-
22
-
23
-
24
-
25
-
26
-
27
-
28
-
29
-
30
-
31
-
32
-
33
-
34
-
35
-
36
-
37
-
38
-
39
-
40
-
41
-
42
-
43
-
44
-
45
-
46
-
47
-
48
-
49
-
50
-
51
-
52
-
53
-
54
-
55
-
56
-
57
-
58
-
59
-
60
-
61
-
62
-
63
-
64
-
65
-
66
-
67
-
68
-
69
-
70
-
71
-
72
-
73
-
74
-
75
-
76
-
77
-
78
-
79
-
80
-
81
-
82
-
83
-
84
-
85
-
86
-
87
-
88
-
89
-
90
-
91
-
92
-
93
-
94
-
95
-
96
-
97
-
98
-
99
-
100
-
101
-
102
-
103
-
104
-
105
-
106
-
107
-
108
-
 109
109 -
 110
110 -
 111
111 -
 112
112 -
 113
113 -
 114
114 -
 115
115 -
 116
116 -
 117
117 -
 118
118 -
 119
119 -
 120
120 -
 121
121 -
 122
122 -
 123
123 -
 124
124 -
 125
125 -
 126
126 -
 127
127 -
 128
128 -
 129
129 -
130
-
131
-
132
-
133
-
134
-
135
-
136
-
137
-
138
-
139
-
140
-
141
-
142
-
143
-
144
-
145
-
146
-
147
-
148
-
149
-
150
-
151
-
152
-
153
-
154
-
155
-
156
-
157
-
158
-
159
-
160
-
161
-
162
-
163
-
164
-
165
-
166
-
167
-
168
-
169
-
170
-
171
-
172
-
173
-
174
-
175
-
176
-
177
-
178
-
179
-
180
-
181
-
182
-
183
-
184
-
185
-
186
-
187
-
188
-
189
-
190
-
191
-
192
-
193
-
194
-
195
-
196
-
197
-
198
-
199
-
200
-
201
-
202
-
203
-
204
-
205
-
206
-
207
-
208
-
209
-
210
-
211
-
212
-
213
-
214
-
215
-
216
-
217
-
218
-
219
-
220
-
221
-
222
-
223
-
224
-
225
-
226
-
227
-
228
-
229
-
230
-
231
-
232
-
233
-
234
-
235
-
236
-
237
-
238
-
239
-
240
-
241
-
242
-
243
-
244
-
245
-
246
-
247
-
248
-
249
-
250
-
251
-
252
-
253
-
254
-
255
-
256
-
257
-
258
-
259
-
260
-
261
-
262
-
263
-
264
-
265
-
266
-
267
-
268
-
269
-
270
 |
 |
115
3
GROUP MANAGEMENT REPORT – FINANCIAL REVIEW
Group Business Performance – Income Statement
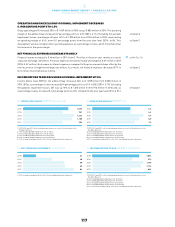
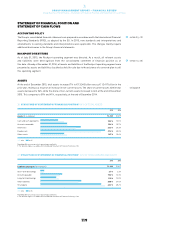
EXPENDITURE FOR POINT-OF-SALE AND MARKETING INVESTMENTS
ASA PERCENTAGE OF SALES INCREASES 0.6 PERCENTAGE POINTS
Expenditure for point-of-sale and marketing investments relates to the Group’s initiatives to strengthen
the desirability of our brands and products. While expenditure for point-of-sale investments consists of
expenses to support the Group’s sell-through development at the point of sale, expenditure for marketing
investments consists of items such as expenses for promotion partnerships, advertising, public relations
and other communication activities. In absolute terms, expenditure for point-of-sale and marketing
investments increased 22% to € 2.348 billion in 2015 from € 1.923 billion in the prior year. This development
mainly reflects the Group’s planned efforts to further strengthen brand desirability, by stepping up
expenditure for point-of-sale and marketing investments. By brand, adidas expenditure for point-of-sale
and marketing investments increased 24% to € 1.897 billion compared to € 1.533 billion in the prior year.
Expenditure for point-of-sale and marketing investments for Reebok grew 22% to € 267 million at year-end
(2014: € 220 million). As a percentage of sales, the Group’s expenditure for point-of-sale and marketing
investments increased by 0.6 percentage points to 13.9% (2014: 13.2%).
OPERATING OVERHEAD EXPENSESASA PERCENTAGE OF SALES
DECREASE 0.2 PERCENTAGE POINTS
Group operating overheads include overhead costs related to marketing, logistics, sales and R&D as well
as central administration. In absolute terms, operating overhead expenses grew 15% to € 4.941 billion in
2015 versus € 4.280 billion in 2014. This was primarily a result of an increase in costs related to logistics,
sales expenditure and central administration. As a percentage of sales, however, operating overhead
expenses decreased 0.2 percentage points to 29.2% (2014: 29.4%).
see Glossary, p. 260
see Glossary, p. 260
see Diagram 18
17OTHER OPERATING EXPENSES BYAREA€ IN MILLIONS
2015 2014
Point-of-sale investments 462 375
Marketing investments 1,886 1,548
Marketing overhead 554 427
Sales force 2,040 1,915
Logistics 859 763
Research & development 139 126
Central administration 1,350 1,050
Total 7,289 6,203
■
2014
■
2015
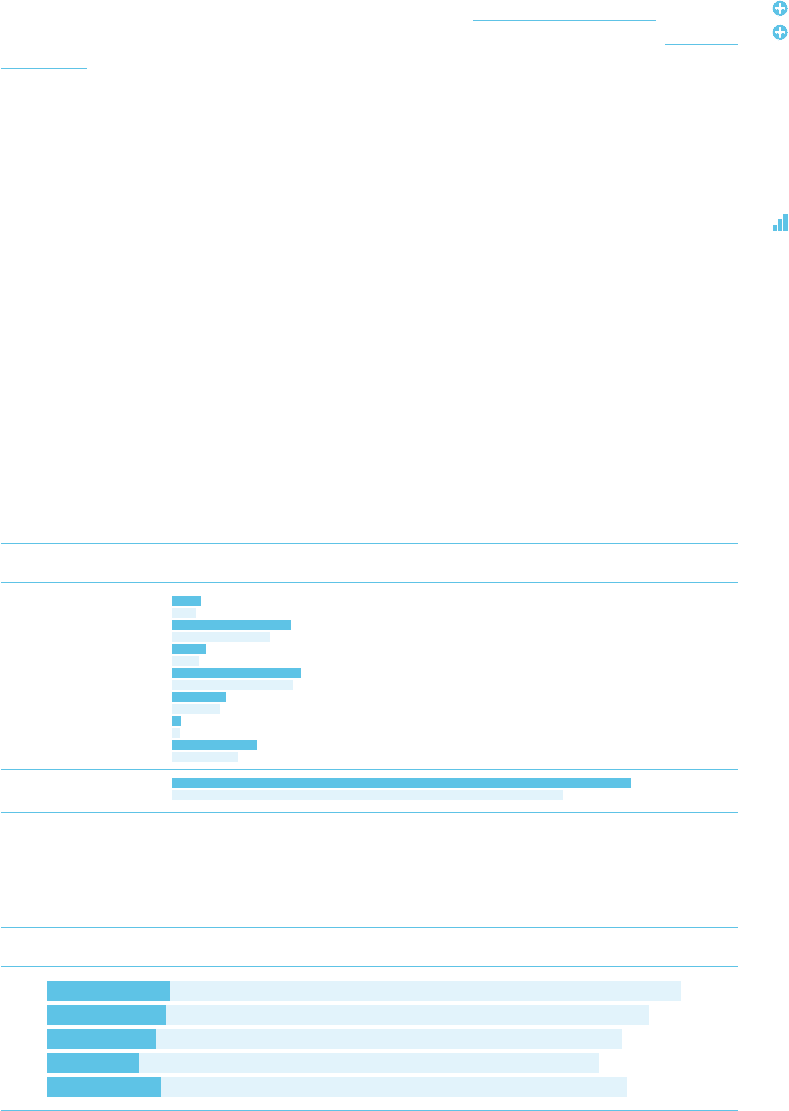
18POINT-OF-SALE AND MARKETING INVESTMENTS 1, 2IN % OF NETSALES
Total
2015 13.9
2014 13.2
2013 12.6
2012 12.1
2011 12.7
■
Point-of-sale investments
■
Marketing investments
1 2015, 2014 and 2013 reflect continuing operations as a result of the divestiture of the Rockport business.
2 2011 restated according to IAS 8 in the 2012 consolidated financial statements.
2.7 11.2
2.6 10.6
2.4 10.2
2.0 10.1
2.5 10.2