Reebok 2015 Annual Report Download - page 142
Download and view the complete annual report
Please find page 142 of the 2015 Reebok annual report below. You can navigate through the pages in the report by either clicking on the pages listed below, or by using the keyword search tool below to find specific information within the annual report.-
 1
1 -
2
-
3
-
4
-
5
-
6
-
7
-
8
-
9
-
10
-
11
-
12
-
13
-
14
-
15
-
16
-
17
-
18
-
19
-
20
-
21
-
22
-
23
-
24
-
25
-
26
-
27
-
28
-
29
-
30
-
31
-
32
-
33
-
34
-
35
-
36
-
37
-
38
-
39
-
40
-
41
-
42
-
43
-
44
-
45
-
46
-
47
-
48
-
49
-
50
-
51
-
52
-
53
-
54
-
55
-
56
-
57
-
58
-
59
-
60
-
61
-
62
-
63
-
64
-
65
-
66
-
67
-
68
-
69
-
70
-
71
-
72
-
73
-
74
-
75
-
76
-
77
-
78
-
79
-
80
-
81
-
82
-
83
-
84
-
85
-
86
-
87
-
88
-
89
-
90
-
91
-
92
-
93
-
94
-
95
-
96
-
97
-
98
-
99
-
100
-
101
-
102
-
103
-
104
-
105
-
106
-
107
-
108
-
109
-
110
-
111
-
112
-
113
-
114
-
115
-
116
-
117
-
118
-
119
-
120
-
121
-
122
-
123
-
124
-
125
-
126
-
127
-
128
-
129
-
130
-
131
-
 132
132 -
 133
133 -
 134
134 -
 135
135 -
 136
136 -
 137
137 -
 138
138 -
 139
139 -
 140
140 -
 141
141 -
 142
142 -
 143
143 -
 144
144 -
 145
145 -
 146
146 -
 147
147 -
 148
148 -
 149
149 -
 150
150 -
 151
151 -
 152
152 -
153
-
154
-
155
-
156
-
157
-
158
-
159
-
160
-
161
-
162
-
163
-
164
-
165
-
166
-
167
-
168
-
169
-
170
-
171
-
172
-
173
-
174
-
175
-
176
-
177
-
178
-
179
-
180
-
181
-
182
-
183
-
184
-
185
-
186
-
187
-
188
-
189
-
190
-
191
-
192
-
193
-
194
-
195
-
196
-
197
-
198
-
199
-
200
-
201
-
202
-
203
-
204
-
205
-
206
-
207
-
208
-
209
-
210
-
211
-
212
-
213
-
214
-
215
-
216
-
217
-
218
-
219
-
220
-
221
-
222
-
223
-
224
-
225
-
226
-
227
-
228
-
229
-
230
-
231
-
232
-
233
-
234
-
235
-
236
-
237
-
238
-
239
-
240
-
241
-
242
-
243
-
244
-
245
-
246
-
247
-
248
-
249
-
250
-
251
-
252
-
253
-
254
-
255
-
256
-
257
-
258
-
259
-
260
-
261
-
262
-
263
-
264
-
265
-
266
-
267
-
268
-
269
-
270
 |
 |

GROUP MANAGEMENT REPORT – FINANCIAL REVIEW
Business Performance by Segment
138
3
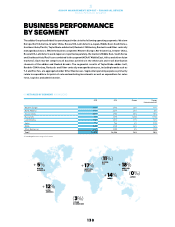
BUSINESS PERFORMANCE
BYSEGMENT
The adidas Group has divided its operating activities into the following operating segments: Western
Europe, North America, Greater China, Russia/CIS, Latin America, Japan, Middle East, South Korea,
Southeast Asia/Pacific, TaylorMade-adidas Golf, Reebok-CCM Hockey, Runtastic and Other centrally
managed businesses. While the business segments Western Europe, North America, Greater China,
Russia/CIS, Latin America and Japan are reported separately, the markets Middle East, South Korea
and Southeast Asia/Pacific are combined to the segment MEAA (’Middle East, Africa and other Asian
markets’). Each market comprises all business activities in the wholesale and retail distribution
channels of the adidas and Reebok brands. The segmental results of TaylorMade-adidas Golf,
Reebok-CCM Hockey, Runtastic and Other centrally managed businesses, including brands such as
Y-3 and Five Ten, are aggregated under Other Businesses. Segmental operating expenses primarily
relate to expenditure for point-of-sale and marketing investments as well as expenditure for sales
force, logistics and administration.
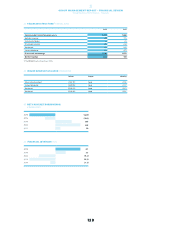
01NETSALES BYSEGMENT€ IN MILLIONS
2015 2014 Change Change
(currency-neutral)
Western Europe 4,539 3,793 20% 17%
North America 2,753 2,217 24% 5%
Greater China 2,469 1,786 38% 18%
Russia/CIS 739 1,098 (33%) (11%)
Latin America 1,783 1,612 11% 12%
Japan 776 744 4% (0%)
MEAA 2,388 1,925 24% 14%
Other Businesses 1,467 1,358 8% (3%)
Total 116,915 14,534 16% 10%
1 Rounding differences may arise in totals.
+ 17%
WESTERN
EUROPE
+ 14%
MEAA
3%
OTHER
BUSINESSES
11%
RUSSIA /
CIS
+ 5%
NORTH
AMERICA
+ 12%
LATIN
AMERICA
+ 18%
GREATER
CHINA
0%
JAPAN