Reebok 2015 Annual Report Download - page 50
Download and view the complete annual report
Please find page 50 of the 2015 Reebok annual report below. You can navigate through the pages in the report by either clicking on the pages listed below, or by using the keyword search tool below to find specific information within the annual report.-
 1
1 -
2
-
3
-
4
-
5
-
6
-
7
-
8
-
9
-
10
-
11
-
12
-
13
-
14
-
15
-
16
-
17
-
18
-
19
-
20
-
21
-
22
-
23
-
24
-
25
-
26
-
27
-
28
-
29
-
30
-
31
-
32
-
33
-
34
-
35
-
36
-
37
-
38
-
39
-
 40
40 -
 41
41 -
 42
42 -
 43
43 -
 44
44 -
 45
45 -
 46
46 -
 47
47 -
 48
48 -
 49
49 -
 50
50 -
 51
51 -
 52
52 -
 53
53 -
 54
54 -
 55
55 -
 56
56 -
 57
57 -
 58
58 -
 59
59 -
 60
60 -
61
-
62
-
63
-
64
-
65
-
66
-
67
-
68
-
69
-
70
-
71
-
72
-
73
-
74
-
75
-
76
-
77
-
78
-
79
-
80
-
81
-
82
-
83
-
84
-
85
-
86
-
87
-
88
-
89
-
90
-
91
-
92
-
93
-
94
-
95
-
96
-
97
-
98
-
99
-
100
-
101
-
102
-
103
-
104
-
105
-
106
-
107
-
108
-
109
-
110
-
111
-
112
-
113
-
114
-
115
-
116
-
117
-
118
-
119
-
120
-
121
-
122
-
123
-
124
-
125
-
126
-
127
-
128
-
129
-
130
-
131
-
132
-
133
-
134
-
135
-
136
-
137
-
138
-
139
-
140
-
141
-
142
-
143
-
144
-
145
-
146
-
147
-
148
-
149
-
150
-
151
-
152
-
153
-
154
-
155
-
156
-
157
-
158
-
159
-
160
-
161
-
162
-
163
-
164
-
165
-
166
-
167
-
168
-
169
-
170
-
171
-
172
-
173
-
174
-
175
-
176
-
177
-
178
-
179
-
180
-
181
-
182
-
183
-
184
-
185
-
186
-
187
-
188
-
189
-
190
-
191
-
192
-
193
-
194
-
195
-
196
-
197
-
198
-
199
-
200
-
201
-
202
-
203
-
204
-
205
-
206
-
207
-
208
-
209
-
210
-
211
-
212
-
213
-
214
-
215
-
216
-
217
-
218
-
219
-
220
-
221
-
222
-
223
-
224
-
225
-
226
-
227
-
228
-
229
-
230
-
231
-
232
-
233
-
234
-
235
-
236
-
237
-
238
-
239
-
240
-
241
-
242
-
243
-
244
-
245
-
246
-
247
-
248
-
249
-
250
-
251
-
252
-
253
-
254
-
255
-
256
-
257
-
258
-
259
-
260
-
261
-
262
-
263
-
264
-
265
-
266
-
267
-
268
-
269
-
270
 |
 |

TO OUR SHAREHOLDERS
Our Share
46
1
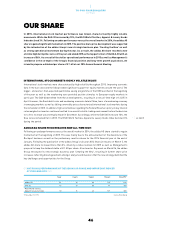
OUR SHARE
In 2015, international stock market performance was mixed, characterised by highly volatile
movements. While the DAX-30 increased by 10%, the MSCI World Textiles, Apparel & Luxury Goods
Index declined 3%. Following an underperformance versus the overall market in 2014, the adidas AG
share regained significant momentum in 2015. The positive share price development was supported
by the introduction of the adidas Group’s new strategic business plan ‘Creating the New’ as well
as strong operational momentum during the year. As a result, the adidas AG share reached a new
all-time high during the course of the year and ended 2015 as the top performer of the DAX-30 with an
increase of 56%. As a result of the stellar operational performance in 2015 as well as Management’s
confidence in the strength of the Group’s financial position and long-term growth aspirations, we
intend to propose a dividend per share of € 1.60 at our 2016 Annual General Meeting.
INTERNATIONAL STOCK MARKETS HIGHLY VOLATILE IN 2015
International stock markets were characterised by high volatility throughout 2015. Improving economic
data in the euro area and the USA provided significant support for equity markets around the world. The
bigger- and earlier-than-expected quantitative easing programme of the ECB launched at the beginning
of the year as well as the weakening euro provided positive stimulus to European equity markets in
particular. The DAX-30 benefited from these developments, resulting in a new all-time high of 12,375 in
April. However, the Greek debt crisis and weakening economic data in China, fears of a weakening economy
in emerging markets as well as falling commodity prices characterised international stock markets during
the remainder of 2015. In addition, high uncertainties regarding the Federal Reserve’s policy on key interest
rates weighed on investor sentiment and led to an overall volatile trading environment before the decision
for a first increase was eventually made in December. Accordingly, while the DAX-30 increased 10%, the
Dow Jones remained flat in 2015. The MSCI World Textiles, Apparel & Luxury Goods Index declined 3%
during the period.
ADIDASAG SHARE PRICE REACHES NEW ALL-TIME HIGH
Following an underperformance versus the overall market in 2014, the adidas AG share started to regain
momentum at the beginning of 2015. This was mainly due to the announcement of the divestiture of the
Rockport business as well as the preliminary results release for the 2014 financial year at the end of
January. Following the publication of the adidas Group’s full year 2014 financial results on March 5, the
adidas AG share increased more than 3%, driven by a robust outlook for 2015 as well as Management’s
proposal to keep the dividend stable at € 1.50 per share. At an Investor Day event on March 26, the adidas
Group introduced its new strategic business plan ‘Creating the New’, resulting in further share price
increases reflecting broad agreement amongst analysts and investors that the new strategy identified the
key challenges and opportunities for the Group.
see Table 01
01 HISTORICAL PERFORMANCE OF THE ADIDASAG SHARE AND IMPORTANT INDICES
AT YEAR-END 2015IN %
1 year 3 years 5 years 10 years Since IPO 1
adidas AG 56 34 84 125 830
DAX-30 10 41 55 99 389
MSCI World Textiles,
Apparel & Luxury Goods (3) 16 40 139 380
1 November 17, 1995. Source: Bloomberg.