Reebok 2015 Annual Report Download - page 123
Download and view the complete annual report
Please find page 123 of the 2015 Reebok annual report below. You can navigate through the pages in the report by either clicking on the pages listed below, or by using the keyword search tool below to find specific information within the annual report.-
 1
1 -
2
-
3
-
4
-
5
-
6
-
7
-
8
-
9
-
10
-
11
-
12
-
13
-
14
-
15
-
16
-
17
-
18
-
19
-
20
-
21
-
22
-
23
-
24
-
25
-
26
-
27
-
28
-
29
-
30
-
31
-
32
-
33
-
34
-
35
-
36
-
37
-
38
-
39
-
40
-
41
-
42
-
43
-
44
-
45
-
46
-
47
-
48
-
49
-
50
-
51
-
52
-
53
-
54
-
55
-
56
-
57
-
58
-
59
-
60
-
61
-
62
-
63
-
64
-
65
-
66
-
67
-
68
-
69
-
70
-
71
-
72
-
73
-
74
-
75
-
76
-
77
-
78
-
79
-
80
-
81
-
82
-
83
-
84
-
85
-
86
-
87
-
88
-
89
-
90
-
91
-
92
-
93
-
94
-
95
-
96
-
97
-
98
-
99
-
100
-
101
-
102
-
103
-
104
-
105
-
106
-
107
-
108
-
109
-
110
-
111
-
112
-
 113
113 -
 114
114 -
 115
115 -
 116
116 -
 117
117 -
 118
118 -
 119
119 -
 120
120 -
 121
121 -
 122
122 -
 123
123 -
 124
124 -
 125
125 -
 126
126 -
 127
127 -
 128
128 -
 129
129 -
 130
130 -
 131
131 -
 132
132 -
 133
133 -
134
-
135
-
136
-
137
-
138
-
139
-
140
-
141
-
142
-
143
-
144
-
145
-
146
-
147
-
148
-
149
-
150
-
151
-
152
-
153
-
154
-
155
-
156
-
157
-
158
-
159
-
160
-
161
-
162
-
163
-
164
-
165
-
166
-
167
-
168
-
169
-
170
-
171
-
172
-
173
-
174
-
175
-
176
-
177
-
178
-
179
-
180
-
181
-
182
-
183
-
184
-
185
-
186
-
187
-
188
-
189
-
190
-
191
-
192
-
193
-
194
-
195
-
196
-
197
-
198
-
199
-
200
-
201
-
202
-
203
-
204
-
205
-
206
-
207
-
208
-
209
-
210
-
211
-
212
-
213
-
214
-
215
-
216
-
217
-
218
-
219
-
220
-
221
-
222
-
223
-
224
-
225
-
226
-
227
-
228
-
229
-
230
-
231
-
232
-
233
-
234
-
235
-
236
-
237
-
238
-
239
-
240
-
241
-
242
-
243
-
244
-
245
-
246
-
247
-
248
-
249
-
250
-
251
-
252
-
253
-
254
-
255
-
256
-
257
-
258
-
259
-
260
-
261
-
262
-
263
-
264
-
265
-
266
-
267
-
268
-
269
-
270
 |
 |
119
3
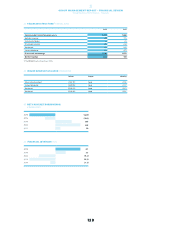
GROUP MANAGEMENT REPORT – FINANCIAL REVIEW
Group Business Performance – Statement of Financial Position and Statement of Cash Flows
STATEMENTOF FINANCIAL POSITION AND
STATEMENTOF CASH FLOWS
ACCOUNTING POLICY
The Group’s consolidated financial statements are prepared in accordance with the International Financial
Reporting Standards (IFRS), as adopted by the EU. In 2015, new standards and interpretations and
amendments to existing standards and interpretations were applicable. The changes mainly require
additional disclosures in the Group’s financial statements.
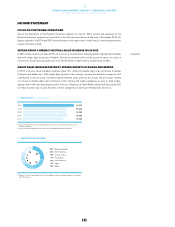
ROCKPORT DIVESTITURE
As of July 31, 2015, the Rockport operating segment was divested. As a result, all relevant assets
and liabilities were derecognised from the consolidated statement of financial position as of
this date. Already at December 31, 2014, all assets and liabilities of the Rockport operating segment were
presented as assets and liabilities classified as held for sale due to the existence of a concrete plan to sell
this operating segment.
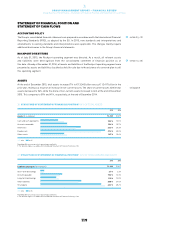
ASSETS
At the end of December 2015, total assets increased 7% to € 13.343 billion versus € 12.417 billion in the
prior year, mainly as a result of an increase in non-current assets. The share of current assets within total
assets decreased to 56%, while the share of non-current assets increased to 44% at the end of December
2015. This compares to 59% and 41%, respectively, at the end of December 2014.
see Note 01, p. 190
see Note 11, p. 205
see Diagram 28
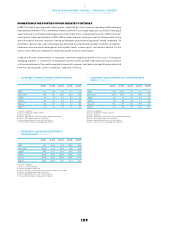
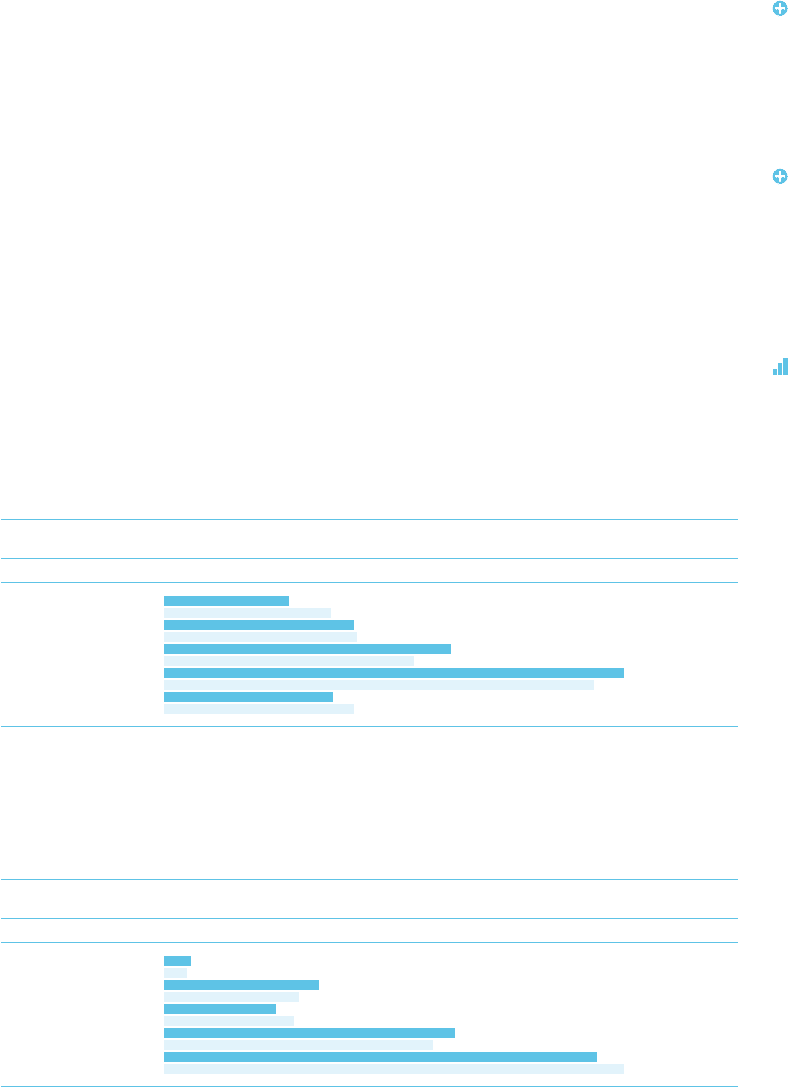
26STRUCTURE OF STATEMENTOF FINANCIAL POSITION 1IN % OF TOTAL ASSETS
2015 2014
Assets (€ in millions) 13,343 12,417
Cash and cash equivalents 10.2% 13.6%
Accounts receivable 15.4% 15.7%
Inventories 23.3% 20.3%
Fixed assets 37.4% 35.0%
Other assets 13.7% 15.4%
■
2014
■
2015
Rounding differences may arise in percentages and totals.
1 For absolute figures see adidas AG Consolidated Statement of Financial Position, p. 182.
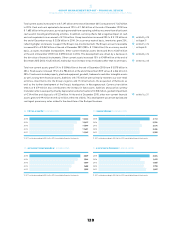
27STRUCTURE OF STATEMENTOF FINANCIAL POSITION 1IN % OF TOTAL LIABILITIESAND EQUITY
2015 2014
Liabilities and equity (€ in millions) 13,343 12,417
Short-term borrowings 2.7% 2.3%
Accounts payable 15.2% 13.3%
Long-term borrowings 11.0% 12.8%
Other liabilities 28.8% 26.4%
Total equity 42.3% 45.2%
■
2014
■
2015
Rounding differences may arise in percentages and totals.
1 For absolute figures see adidas AG Consolidated Statement of Financial Position, p. 182.