MoneyGram 2011 Annual Report Download - page 99
Download and view the complete annual report
Please find page 99 of the 2011 MoneyGram annual report below. You can navigate through the pages in the report by either clicking on the pages listed below, or by using the keyword search tool below to find specific information within the annual report.-
 1
1 -
2
-
3
-
4
-
5
-
6
-
7
-
8
-
9
-
10
-
11
-
12
-
13
-
14
-
15
-
16
-
17
-
18
-
19
-
20
-
21
-
22
-
23
-
24
-
25
-
26
-
27
-
28
-
29
-
30
-
31
-
32
-
33
-
34
-
35
-
36
-
37
-
38
-
39
-
40
-
41
-
42
-
43
-
44
-
45
-
46
-
47
-
48
-
49
-
50
-
51
-
52
-
53
-
54
-
55
-
56
-
57
-
58
-
59
-
60
-
61
-
62
-
63
-
64
-
65
-
66
-
67
-
68
-
69
-
70
-
71
-
72
-
73
-
74
-
75
-
76
-
77
-
78
-
79
-
80
-
81
-
82
-
83
-
84
-
85
-
86
-
87
-
88
-
 89
89 -
 90
90 -
 91
91 -
 92
92 -
 93
93 -
 94
94 -
 95
95 -
 96
96 -
 97
97 -
 98
98 -
 99
99 -
 100
100 -
 101
101 -
 102
102 -
 103
103 -
 104
104 -
 105
105 -
 106
106 -
 107
107 -
 108
108 -
 109
109 -
110
-
111
-
112
-
113
-
114
-
115
-
116
-
117
-
118
-
119
-
120
-
121
-
122
-
123
-
124
-
125
-
126
-
127
-
128
-
129
-
130
-
131
-
132
-
133
-
134
-
135
-
136
-
137
-
138
-
139
-
140
-
141
-
142
-
143
-
144
-
145
-
146
-
147
-
148
-
149
-
150
-
151
-
152
-
153
-
154
-
155
-
156
-
157
-
158
-
159
-
160
-
161
-
162
-
163
-
164
-
165
-
166
-
167
-
168
-
169
-
170
-
171
-
172
-
173
-
174
-
175
-
176
-
177
-
178
-
179
-
180
-
181
-
182
-
183
-
184
-
185
-
186
-
187
-
188
-
189
-
190
-
191
-
192
-
193
-
194
-
195
-
196
-
197
-
198
-
199
-
200
-
201
-
202
-
203
-
204
-
205
-
206
-
207
-
208
-
209
-
210
-
211
-
212
-
213
-
214
-
215
-
216
-
217
-
218
-
219
-
220
-
221
-
222
-
223
-
224
-
225
-
226
-
227
-
228
-
229
-
230
-
231
-
232
-
233
-
234
-
235
-
236
-
237
-
238
-
239
-
240
-
241
-
242
-
243
-
244
-
245
-
246
-
247
-
248
-
249
 |
 |

Table of Contents
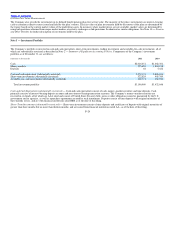
• Investment revenue is derived from the investment of funds generated from the sale of payment instruments, primarily official checks and money
orders, and consists of interest income, dividend income and amortization of premiums and discounts.
Fee and Other Commissions Expense — The Company pays fee commissions to third−party agents for money transfer and bill payment products. In a
money transfer transaction, both the agent initiating the transaction and the agent disbursing the funds receive a commission that is generally based on a
percentage of the fee charged to the customer. The Company generally does not pay commissions to agents on the sale of money orders. Fee commissions
are recognized at the time of the transaction. Other commissions expense includes the amortization of capitalized signing bonus payments.
Investment Commissions Expense — Investment commissions expense consists of amounts paid to financial institution customers based on short−term
interest rate indices times the average outstanding cash balances of official checks sold by the financial institution. Investment commissions are recognized
each month based on the average outstanding balances of each financial institution customer and their contractual variable rate for that month.
Marketing and Advertising Expense — Marketing and advertising costs are expensed as incurred or at the time the advertising first takes place and are
recorded in the “Transaction and operations support” line in the Consolidated Statements of Income (Loss). Marketing and advertising expense was $57.5
million, $47.1 million and $40.2 million for 2011, 2010 and 2009, respectively.
Stock−Based Compensation — All stock−based compensation awards are measured at fair value at the date of grant and expensed over their vesting or
service periods. Expense, net of estimated forfeitures, is recognized using the straight−line method. See Note 13 — Stock−Based Compensation for further
discussion of the Company’s stock−based compensation.
Restructuring and Reorganization Expenses — Restructuring and reorganization expenses may consist of direct and incremental costs associated with
restructuring and related activities, including severance; outplacement and other employee related benefits; facility closures, cease−use or related charges;
asset impairments or accelerated depreciation; and other expenses related to relocation of various operations to existing or new Company facilities and
third−party providers, including hiring, training, relocation, travel and professional fees. The Company records severance−related expenses once they are
both probable and estimable related to severance provided under an on−going benefit arrangement. One−time, involuntary benefit arrangements and other
exit costs are generally recognized when the liability is incurred. The Company evaluates impairment issues associated with restructuring activities when the
carrying amount of the assets may not be fully recoverable, and also reviews the appropriateness of the remaining useful lives of impacted fixed assets.
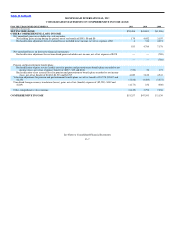
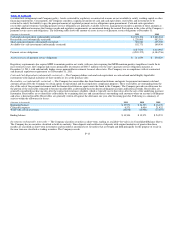
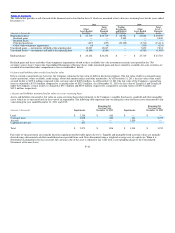
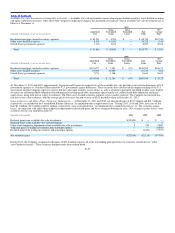
In connection with restructuring and related activities during 2011 and 2010, the Company recorded total expenses of $23.5 million and $5.9 million,
respectively. Restructuring activities consisted of severance costs recorded in the “Compensation and benefits” line, general restructuring costs recorded in
the “Transaction and operations support” line and facilities and certain related asset write−off charges recorded in the “Occupancy, equipment and supplies”
line in the operating expense section of the Consolidated Statements of Income. During 2011, the Company recognized an impairment charge of $2.3
million for restructuring−related efforts to dispose of land held for non−operating purposes. The impairment charge was recorded in the “Other” line of the
Consolidated Statements of Income. Restructuring costs recorded consist of the following:
(Amounts in thousands) 2011 2010 2009
Restructuring costs in operating expenses:
Compensation and benefits $ 4,696 $2,970 $—
Transaction and operations support 13,707 1,303 —
Occupancy, equipment and supplies 2,694 1,580 —
Restructuring costs in non−operating expenses:
Other 2,373 — —
Total restructuring costs $23,470 $5,853 $ —
F−17