MoneyGram 2011 Annual Report Download - page 48
Download and view the complete annual report
Please find page 48 of the 2011 MoneyGram annual report below. You can navigate through the pages in the report by either clicking on the pages listed below, or by using the keyword search tool below to find specific information within the annual report.-
 1
1 -
2
-
3
-
4
-
5
-
6
-
7
-
8
-
9
-
10
-
11
-
12
-
13
-
14
-
15
-
16
-
17
-
18
-
19
-
20
-
21
-
22
-
23
-
24
-
25
-
26
-
27
-
28
-
29
-
30
-
31
-
32
-
33
-
34
-
35
-
36
-
37
-
 38
38 -
 39
39 -
 40
40 -
 41
41 -
 42
42 -
 43
43 -
 44
44 -
 45
45 -
 46
46 -
 47
47 -
 48
48 -
 49
49 -
 50
50 -
 51
51 -
 52
52 -
 53
53 -
 54
54 -
 55
55 -
 56
56 -
 57
57 -
 58
58 -
59
-
60
-
61
-
62
-
63
-
64
-
65
-
66
-
67
-
68
-
69
-
70
-
71
-
72
-
73
-
74
-
75
-
76
-
77
-
78
-
79
-
80
-
81
-
82
-
83
-
84
-
85
-
86
-
87
-
88
-
89
-
90
-
91
-
92
-
93
-
94
-
95
-
96
-
97
-
98
-
99
-
100
-
101
-
102
-
103
-
104
-
105
-
106
-
107
-
108
-
109
-
110
-
111
-
112
-
113
-
114
-
115
-
116
-
117
-
118
-
119
-
120
-
121
-
122
-
123
-
124
-
125
-
126
-
127
-
128
-
129
-
130
-
131
-
132
-
133
-
134
-
135
-
136
-
137
-
138
-
139
-
140
-
141
-
142
-
143
-
144
-
145
-
146
-
147
-
148
-
149
-
150
-
151
-
152
-
153
-
154
-
155
-
156
-
157
-
158
-
159
-
160
-
161
-
162
-
163
-
164
-
165
-
166
-
167
-
168
-
169
-
170
-
171
-
172
-
173
-
174
-
175
-
176
-
177
-
178
-
179
-
180
-
181
-
182
-
183
-
184
-
185
-
186
-
187
-
188
-
189
-
190
-
191
-
192
-
193
-
194
-
195
-
196
-
197
-
198
-
199
-
200
-
201
-
202
-
203
-
204
-
205
-
206
-
207
-
208
-
209
-
210
-
211
-
212
-
213
-
214
-
215
-
216
-
217
-
218
-
219
-
220
-
221
-
222
-
223
-
224
-
225
-
226
-
227
-
228
-
229
-
230
-
231
-
232
-
233
-
234
-
235
-
236
-
237
-
238
-
239
-
240
-
241
-
242
-
243
-
244
-
245
-
246
-
247
-
248
-
249
 |
 |

Table of Contents
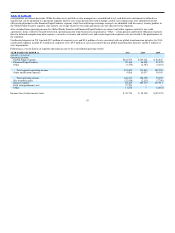
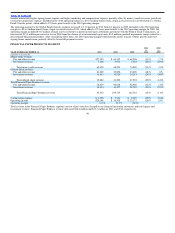
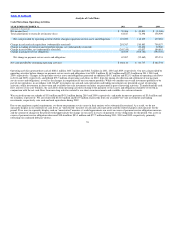
Financial Paper Products Revenue
YEAR ENDED DECEMBER 31, 2011 2010
(Amounts in thousands)
Financial Paper Products revenue for the prior year $109,515 $122,783
Change in:
Investment Revenue
Lower yields (1,946) (7,480)
Average investable balances (2,484) (4,398)
Other investment revenue (134) 1,557
Money order fee and other revenue (6,992) (4,954)
Official check fee and other revenue (4,627) 2,007
Financial Paper Products revenue for the year ended December 31 $ 93,332 $109,515
Money order fee and other revenue decreased in 2011 due to a seven percent decline in volumes attributed to the attrition of agents from repricing
initiatives, the continued migration by consumers to other payment methods, consumer pricing increases as agents pass along fee increases and the general
economic environment. Official check fee and other revenue decreased from 2010 due to the run−off of official check financial institution customers. See
Net Investment Revenue Analysis for discussion related to changes in investment revenue.
In 2010, money order fee and other revenue decreased due to a 15 percent decline in volumes attributed to the anticipated attrition of agents from repricing
initiatives, the continued migration by consumers to other payment methods, consumer pricing increases as agents pass along fee increases and the general
economic environment. Official check fee and other revenue increased from 2009 due to our official check repricing initiatives, partially offset by the
run−off of official check financial institution customers. See Net Investment Revenue Analysis for discussion related to changes in investment revenue.
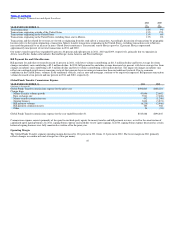
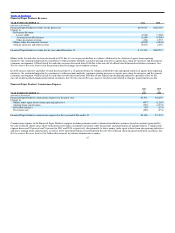
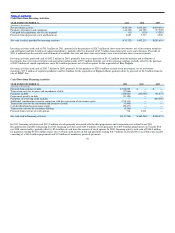
Financial Paper Products Commissions Expense
2011 2010
vs. vs.
YEAR ENDED DECEMBER 31, 2010 2009
(Amounts in thousands)
Financial Paper Products commissions expense for the prior year $3,931 $ 8,295
Change in:
Money order agent rebates from repricing initiatives (957) (1,267)
Signing bonus amortization (272) (2,472)
Investable balances (97) (174)
Investment rate (209) (451)
Financial Paper Products commissions expense for the year ended December 31 $2,396 $ 3,931
Commissions expense in the Financial Paper Products segment includes payments made to financial institution customers based on amounts generated by
the sale of official checks times short−term interest rate indices, payments on money order transactions and amortization of signing bonuses. Commissions
expense decreased 39 percent and 53 percent in 2011 and 2010, respectively, due primarily to lower money order agent rebates from our repricing initiatives
and lower signing bonus amortization, as well as lower investment balances resulting from the run−off of official check financial institution customers. See
Net Investment Revenue Analysis for further discussion of investment commissions expense.
47