MoneyGram 2011 Annual Report Download - page 138
Download and view the complete annual report
Please find page 138 of the 2011 MoneyGram annual report below. You can navigate through the pages in the report by either clicking on the pages listed below, or by using the keyword search tool below to find specific information within the annual report.-
 1
1 -
2
-
3
-
4
-
5
-
6
-
7
-
8
-
9
-
10
-
11
-
12
-
13
-
14
-
15
-
16
-
17
-
18
-
19
-
20
-
21
-
22
-
23
-
24
-
25
-
26
-
27
-
28
-
29
-
30
-
31
-
32
-
33
-
34
-
35
-
36
-
37
-
38
-
39
-
40
-
41
-
42
-
43
-
44
-
45
-
46
-
47
-
48
-
49
-
50
-
51
-
52
-
53
-
54
-
55
-
56
-
57
-
58
-
59
-
60
-
61
-
62
-
63
-
64
-
65
-
66
-
67
-
68
-
69
-
70
-
71
-
72
-
73
-
74
-
75
-
76
-
77
-
78
-
79
-
80
-
81
-
82
-
83
-
84
-
85
-
86
-
87
-
88
-
89
-
90
-
91
-
92
-
93
-
94
-
95
-
96
-
97
-
98
-
99
-
100
-
101
-
102
-
103
-
104
-
105
-
106
-
107
-
108
-
109
-
110
-
111
-
112
-
113
-
114
-
115
-
116
-
117
-
118
-
119
-
120
-
121
-
122
-
123
-
124
-
125
-
126
-
127
-
 128
128 -
 129
129 -
 130
130 -
 131
131 -
 132
132 -
 133
133 -
 134
134 -
 135
135 -
 136
136 -
 137
137 -
 138
138 -
 139
139 -
 140
140 -
 141
141 -
 142
142 -
 143
143 -
 144
144 -
 145
145 -
 146
146 -
 147
147 -
 148
148 -
149
-
150
-
151
-
152
-
153
-
154
-
155
-
156
-
157
-
158
-
159
-
160
-
161
-
162
-
163
-
164
-
165
-
166
-
167
-
168
-
169
-
170
-
171
-
172
-
173
-
174
-
175
-
176
-
177
-
178
-
179
-
180
-
181
-
182
-
183
-
184
-
185
-
186
-
187
-
188
-
189
-
190
-
191
-
192
-
193
-
194
-
195
-
196
-
197
-
198
-
199
-
200
-
201
-
202
-
203
-
204
-
205
-
206
-
207
-
208
-
209
-
210
-
211
-
212
-
213
-
214
-
215
-
216
-
217
-
218
-
219
-
220
-
221
-
222
-
223
-
224
-
225
-
226
-
227
-
228
-
229
-
230
-
231
-
232
-
233
-
234
-
235
-
236
-
237
-
238
-
239
-
240
-
241
-
242
-
243
-
244
-
245
-
246
-
247
-
248
-
249
 |
 |
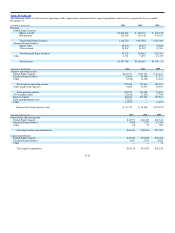
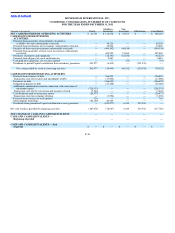
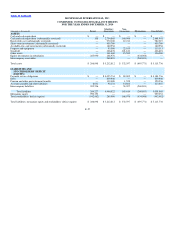
Table of Contents MONEYGRAM INTERNATIONAL, INC.
CONDENSED, CONSOLIDATING STATEMENTS OF CASH FLOWS
FOR THE YEAR ENDED DECEMBER 31, 2011
Subsidiary Non−
(Amounts in thousands) Parent Guarantors Guarantors Eliminations Consolidated
NET CASH PROVIDED BY OPERATING ACTIVITIES $ 41,701 $ 112,536 $ 33,873 $ — $ 188,110
CASH FLOWS FROM INVESTING
ACTIVITIES:
Proceeds from maturities of investments classified as
available−for−sale (substantially restricted) — 56,320 — — 56,320
Proceeds from settlements of investments (substantially restricted) — 32,820 — — 32,820
Purchase of short−term investments (substantially restricted) — (494,142) (46,196) — (540,338)
Proceeds from maturities of short−term investments (substantially
restricted) — 400,500 21,969 — 422,469
Purchases of property and equipment — (28,191) (16,032) — (44,223)
Proceeds from disposal of assets and businesses — 2,683 — — 2,683
Cash paid for acquisitions, net of cash acquired — — (53) — (53)
Dividends to parent/Capital contribution from subsidiary guarantors 241,977 (6,439) — (235,538) —
Net cash provided by (used in) investing activities 241,977 (36,449) (40,312) (235,538) (70,322)
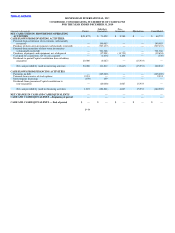
CASH FLOWS FROM FINANCING ACTIVITIES:
Proceeds from issuance of debt — 536,025 — — 536,025
Transaction costs for issuance and amendment of debt — (17,066) — — (17,066)
Payments on debt — (366,625) — — (366,625)
Prepayment penalty on debt — (23,188) — — (23,188)
Additional consideration issued in connection with conversion of
mezzanine equity (218,333) — — — (218,333)
Transaction costs for the conversion and issuance of stock (5,444) — — — (5,444)
Cash dividends paid on mezzanine equity (20,477) — — — (20,477)
Transaction costs for secondary offering — (3,396) — — (3,396)
Proceeds from exercise of stock options 716 — — — 716
Intercompany financings (40,140) 40,140 — — —
Dividends from guarantors/Capital contribution to non−guarantors — (241,977) 6,439 235,538 —
Net cash (used in) provided by financing activities (283,678) (76,087) 6,439 235,538 (117,788)
NET CHANGE IN CASH AND CASH EQUIVALENTS — — — — —
CASH AND CASH EQUIVALENTS —
Beginning of period — — — — —
CASH AND CASH EQUIVALENTS — End
of period $ — $ — $ — $ — $ —
F−56