MoneyGram 2011 Annual Report Download - page 139
Download and view the complete annual report
Please find page 139 of the 2011 MoneyGram annual report below. You can navigate through the pages in the report by either clicking on the pages listed below, or by using the keyword search tool below to find specific information within the annual report.-
 1
1 -
2
-
3
-
4
-
5
-
6
-
7
-
8
-
9
-
10
-
11
-
12
-
13
-
14
-
15
-
16
-
17
-
18
-
19
-
20
-
21
-
22
-
23
-
24
-
25
-
26
-
27
-
28
-
29
-
30
-
31
-
32
-
33
-
34
-
35
-
36
-
37
-
38
-
39
-
40
-
41
-
42
-
43
-
44
-
45
-
46
-
47
-
48
-
49
-
50
-
51
-
52
-
53
-
54
-
55
-
56
-
57
-
58
-
59
-
60
-
61
-
62
-
63
-
64
-
65
-
66
-
67
-
68
-
69
-
70
-
71
-
72
-
73
-
74
-
75
-
76
-
77
-
78
-
79
-
80
-
81
-
82
-
83
-
84
-
85
-
86
-
87
-
88
-
89
-
90
-
91
-
92
-
93
-
94
-
95
-
96
-
97
-
98
-
99
-
100
-
101
-
102
-
103
-
104
-
105
-
106
-
107
-
108
-
109
-
110
-
111
-
112
-
113
-
114
-
115
-
116
-
117
-
118
-
119
-
120
-
121
-
122
-
123
-
124
-
125
-
126
-
127
-
128
-
 129
129 -
 130
130 -
 131
131 -
 132
132 -
 133
133 -
 134
134 -
 135
135 -
 136
136 -
 137
137 -
 138
138 -
 139
139 -
 140
140 -
 141
141 -
 142
142 -
 143
143 -
 144
144 -
 145
145 -
 146
146 -
 147
147 -
 148
148 -
 149
149 -
150
-
151
-
152
-
153
-
154
-
155
-
156
-
157
-
158
-
159
-
160
-
161
-
162
-
163
-
164
-
165
-
166
-
167
-
168
-
169
-
170
-
171
-
172
-
173
-
174
-
175
-
176
-
177
-
178
-
179
-
180
-
181
-
182
-
183
-
184
-
185
-
186
-
187
-
188
-
189
-
190
-
191
-
192
-
193
-
194
-
195
-
196
-
197
-
198
-
199
-
200
-
201
-
202
-
203
-
204
-
205
-
206
-
207
-
208
-
209
-
210
-
211
-
212
-
213
-
214
-
215
-
216
-
217
-
218
-
219
-
220
-
221
-
222
-
223
-
224
-
225
-
226
-
227
-
228
-
229
-
230
-
231
-
232
-
233
-
234
-
235
-
236
-
237
-
238
-
239
-
240
-
241
-
242
-
243
-
244
-
245
-
246
-
247
-
248
-
249
 |
 |

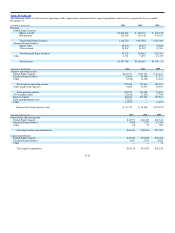
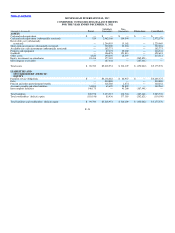
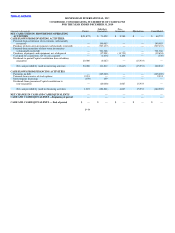
Table of Contents MONEYGRAM INTERNATIONAL, INC.
CONDENSED, CONSOLIDATING BALANCE SHEETS
FOR THE YEAR ENDED DECEMBER 31, 2010
Subsidiary Non−
(Amounts in thousands) Parent Guarantors Guarantors Eliminations Consolidated
ASSETS
Cash and cash equivalents $ — $ — $ — $ — $ —
Cash and cash equivalents (substantially restricted) 108 2,704,865 160,968 — 2,865,941
Receivables, net (substantially restricted) — 970,108 12,211 — 982,319
Short−term investments (substantially restricted) — 405,769 — — 405,769
Available−for−sale investments (substantially restricted) — 160,936 — — 160,936
Property and equipment — 93,006 22,105 — 115,111
Goodwill — 306,878 121,813 — 428,691
Other assets — 141,469 15,500 — 156,969
Equity investments in subsidiaries 265,990 168,978 — (434,968) —
Intercompany receivables 260,803 — (260,803) —
Total assets $ 266,098 $ 5,212,812 $ 332,597 $ (695,771) $ 5,115,736
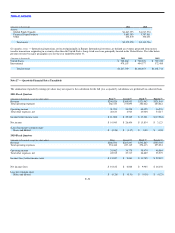
LIABILITIES AND
STOCKHOLDERS’ DEFICIT
(EQUITY)
Payment service obligations $ — $ 4,095,734 $ 89,002 $ — $ 4,184,736
Debt — 639,946 — — 639,946
Pension and other postretirement benefits — 119,008 1,528 — 120,536
Accounts payable and other liabilities 6,631 92,134 14,882 — 113,647
Intercompany liabilities 202,596 — 58,207 (260,803) —
Total liabilities 209,227 4,946,822 163,619 (260,803) 5,058,865
Mezzanine equity 999,353 — — — 999,353
Total stockholders’ deficit (equity) (942,482) 265,990 168,978 (434,968) (942,482)
Total liabilities, mezzanine equity and stockholders’ deficit (equity) $ 266,098 $ 5,212,812 $ 332,597 $ (695,771) $ 5,115,736
F−57