MoneyGram 2011 Annual Report Download - page 115
Download and view the complete annual report
Please find page 115 of the 2011 MoneyGram annual report below. You can navigate through the pages in the report by either clicking on the pages listed below, or by using the keyword search tool below to find specific information within the annual report.-
 1
1 -
2
-
3
-
4
-
5
-
6
-
7
-
8
-
9
-
10
-
11
-
12
-
13
-
14
-
15
-
16
-
17
-
18
-
19
-
20
-
21
-
22
-
23
-
24
-
25
-
26
-
27
-
28
-
29
-
30
-
31
-
32
-
33
-
34
-
35
-
36
-
37
-
38
-
39
-
40
-
41
-
42
-
43
-
44
-
45
-
46
-
47
-
48
-
49
-
50
-
51
-
52
-
53
-
54
-
55
-
56
-
57
-
58
-
59
-
60
-
61
-
62
-
63
-
64
-
65
-
66
-
67
-
68
-
69
-
70
-
71
-
72
-
73
-
74
-
75
-
76
-
77
-
78
-
79
-
80
-
81
-
82
-
83
-
84
-
85
-
86
-
87
-
88
-
89
-
90
-
91
-
92
-
93
-
94
-
95
-
96
-
97
-
98
-
99
-
100
-
101
-
102
-
103
-
104
-
 105
105 -
 106
106 -
 107
107 -
 108
108 -
 109
109 -
 110
110 -
 111
111 -
 112
112 -
 113
113 -
 114
114 -
 115
115 -
 116
116 -
 117
117 -
 118
118 -
 119
119 -
 120
120 -
 121
121 -
 122
122 -
 123
123 -
 124
124 -
 125
125 -
126
-
127
-
128
-
129
-
130
-
131
-
132
-
133
-
134
-
135
-
136
-
137
-
138
-
139
-
140
-
141
-
142
-
143
-
144
-
145
-
146
-
147
-
148
-
149
-
150
-
151
-
152
-
153
-
154
-
155
-
156
-
157
-
158
-
159
-
160
-
161
-
162
-
163
-
164
-
165
-
166
-
167
-
168
-
169
-
170
-
171
-
172
-
173
-
174
-
175
-
176
-
177
-
178
-
179
-
180
-
181
-
182
-
183
-
184
-
185
-
186
-
187
-
188
-
189
-
190
-
191
-
192
-
193
-
194
-
195
-
196
-
197
-
198
-
199
-
200
-
201
-
202
-
203
-
204
-
205
-
206
-
207
-
208
-
209
-
210
-
211
-
212
-
213
-
214
-
215
-
216
-
217
-
218
-
219
-
220
-
221
-
222
-
223
-
224
-
225
-
226
-
227
-
228
-
229
-
230
-
231
-
232
-
233
-
234
-
235
-
236
-
237
-
238
-
239
-
240
-
241
-
242
-
243
-
244
-
245
-
246
-
247
-
248
-
249
 |
 |

Table of Contents
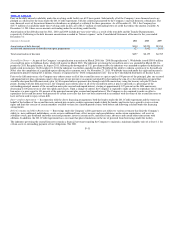
Supplemental Executive Retirement Plans — The Company has obligations under various Supplemental Executive Retirement Plans (“SERPs”), which are
unfunded non−qualified defined benefit pension plans providing postretirement income to their participants. As of December 31, 2011, all benefit accruals
under the SERPs are frozen with the exception of one plan for which service is frozen but future pay increases are reflected for active participants. It is the
Company’s policy to fund the SERPs as benefits are paid.
Postretirement Benefits Other Than Pensions — The Company has unfunded defined benefit postretirement plans that provide medical and life insurance
for its participants. The Company amended the postretirement benefit plan to close it to new participants as of December 31, 2009. Effective July 1, 2011,
the plan was amended to eliminate eligibility for participants eligible for Medicare coverage. As a result of this plan amendment, the Company no longer
receives the Medicare retiree drug subsidy. The Company’s funding policy is to make contributions to the postretirement benefits plans as benefits are paid.
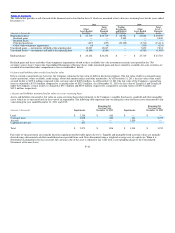
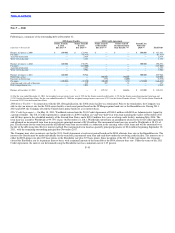
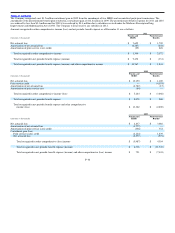
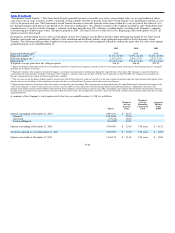
Actuarial Valuation Assumptions — The measurement date for the Company’s defined benefit pension plan, SERPs and postretirement benefit plans is
December 31. Following are the weighted−average actuarial assumptions used in calculating the benefit obligation and net benefit cost as of and for the
years ended December 31:
Pension SERPs Postretirement Benefits
2011 2010 2009 2011 2010 2009 2011 2010 2009
Net periodic benefit cost:
Discount rate 5.30% 5.80% 6.30% 5.30% 5.80% 6.30% 5.30% 5.80% 6.30%
Expected return on plan assets 8.00% 8.00% 8.00% — — — — — —
Rate of compensation increase — — — 5.75% 5.75% 5.75% — — —
Initial healthcare cost trend rate — — — — — — 9.00% 9.50% 8.50%
Ultimate healthcare cost trend rate — — — — — — 5.00% 5.00% 5.00%
Year ultimate healthcare cost trend rate is reached — — — — — — 2019 2019 2013
Projected benefit obligation:
Discount rate 4.90% 5.30% 5.80% 4.80% 5.30% 5.80% 4.90% 5.30% 5.80%
Rate of compensation increase — — — 5.75% 5.75% 5.75% — — —
Initial healthcare cost trend rate — — — — — — 8.50% 9.00% 9.50%
Ultimate healthcare cost trend rate — — — — — — 5.00% 5.00% 5.00%
Year ultimate healthcare cost trend rate is reached — — — — — — 2019 2019 2019
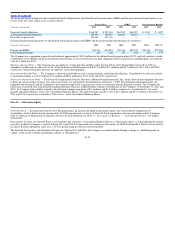
The Company utilizes a building−block approach in determining the long−term expected rate of return on plan assets. Historical markets are studied and
long−term historical relationships between equity securities and fixed income securities are preserved consistent with the widely accepted capital market
principle that assets with higher volatility generate a greater return over the long run. Current market factors, such as inflation and interest rates, are
evaluated before long−term capital market assumptions are determined. The long−term portfolio return also takes proper consideration of diversification and
rebalancing. Peer data and historical returns are reviewed for reasonableness and appropriateness.
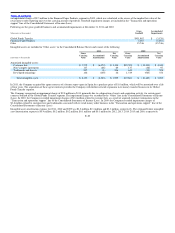
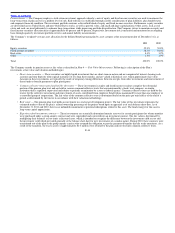
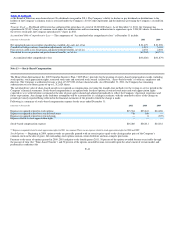
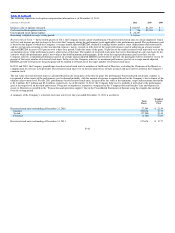
A one−percentage point change in assumed health care trends would have the following effects for 2011:
(Amounts in thousands) One Percentage
Point Increase One Percentage
Point Decrease
Effect on total of service and interest cost components $ 12 $ (10)
Effect on postretirement benefit obligation 238 (196)
F−33