MoneyGram 2011 Annual Report Download - page 133
Download and view the complete annual report
Please find page 133 of the 2011 MoneyGram annual report below. You can navigate through the pages in the report by either clicking on the pages listed below, or by using the keyword search tool below to find specific information within the annual report.-
 1
1 -
2
-
3
-
4
-
5
-
6
-
7
-
8
-
9
-
10
-
11
-
12
-
13
-
14
-
15
-
16
-
17
-
18
-
19
-
20
-
21
-
22
-
23
-
24
-
25
-
26
-
27
-
28
-
29
-
30
-
31
-
32
-
33
-
34
-
35
-
36
-
37
-
38
-
39
-
40
-
41
-
42
-
43
-
44
-
45
-
46
-
47
-
48
-
49
-
50
-
51
-
52
-
53
-
54
-
55
-
56
-
57
-
58
-
59
-
60
-
61
-
62
-
63
-
64
-
65
-
66
-
67
-
68
-
69
-
70
-
71
-
72
-
73
-
74
-
75
-
76
-
77
-
78
-
79
-
80
-
81
-
82
-
83
-
84
-
85
-
86
-
87
-
88
-
89
-
90
-
91
-
92
-
93
-
94
-
95
-
96
-
97
-
98
-
99
-
100
-
101
-
102
-
103
-
104
-
105
-
106
-
107
-
108
-
109
-
110
-
111
-
112
-
113
-
114
-
115
-
116
-
117
-
118
-
119
-
120
-
121
-
122
-
 123
123 -
 124
124 -
 125
125 -
 126
126 -
 127
127 -
 128
128 -
 129
129 -
 130
130 -
 131
131 -
 132
132 -
 133
133 -
 134
134 -
 135
135 -
 136
136 -
 137
137 -
 138
138 -
 139
139 -
 140
140 -
 141
141 -
 142
142 -
 143
143 -
144
-
145
-
146
-
147
-
148
-
149
-
150
-
151
-
152
-
153
-
154
-
155
-
156
-
157
-
158
-
159
-
160
-
161
-
162
-
163
-
164
-
165
-
166
-
167
-
168
-
169
-
170
-
171
-
172
-
173
-
174
-
175
-
176
-
177
-
178
-
179
-
180
-
181
-
182
-
183
-
184
-
185
-
186
-
187
-
188
-
189
-
190
-
191
-
192
-
193
-
194
-
195
-
196
-
197
-
198
-
199
-
200
-
201
-
202
-
203
-
204
-
205
-
206
-
207
-
208
-
209
-
210
-
211
-
212
-
213
-
214
-
215
-
216
-
217
-
218
-
219
-
220
-
221
-
222
-
223
-
224
-
225
-
226
-
227
-
228
-
229
-
230
-
231
-
232
-
233
-
234
-
235
-
236
-
237
-
238
-
239
-
240
-
241
-
242
-
243
-
244
-
245
-
246
-
247
-
248
-
249
 |
 |

Table of Contents
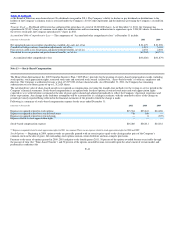
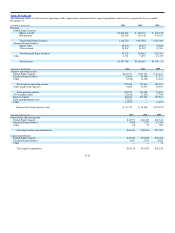
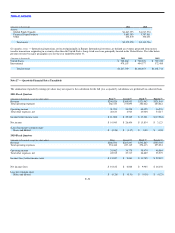
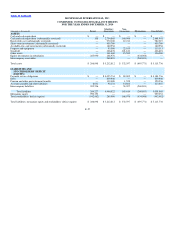
The following tables set forth revenue, operating results, depreciation and amortization, capital expenditures and assets by segment for the year ended
December 31:
(Amounts in thousands) 2011 2010 2009
Revenue
Global Funds Transfer:
Money transfer $1,040,087 $ 926,733 $ 890,838
Bill payment 112,629 126,548 134,611
Total Global Funds Transfer 1,152,716 1,053,281 1,025,449
Financial Paper Products:
Money order 60,450 68,293 74,880
Official check 32,882 41,222 47,903
Total Financial Paper Products 93,332 109,515 122,783
Other 1,721 3,857 13,479
Total revenue $1,247,769 $1,166,653 $1,161,711
(Amounts in thousands) 2011 2010 2009
Segment operating income:
Global Funds Transfer $124,793 $139,314 $ 82,647
Financial Paper Products 29,168 36,508 27,372
Other (1,556) (2,367) (4,316)
Total segment operating income 152,405 173,455 105,703
Other unallocated expenses 9,888 15,057 30,305
Total operating income 142,517 158,398 75,398
Net securities gains (32,816) (2,115) (7,790)
Interest expense 86,165 102,133 107,911
Debt extinguishment costs 37,522 — —
Other 11,876 — (2,401)
Income (loss) before income taxes $ 39,770 $ 58,380 $(22,322)
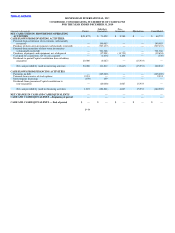
(Amounts in thousands) 2011 2010 2009
Depreciation and amortization:
Global Funds Transfer $40,575 $40,489 $43,512
Financial Paper Products 5,408 7,527 12,590
Other 68 58 989
Total depreciation and amortization $46,051 $48,074 $57,091
Capital expenditures:
Global Funds Transfer $44,269 $37,090 $32,236
Financial Paper Products 5,867 5,935 6,005
Other — — 17
Total capital expenditures $50,136 $43,025 $38,258
F−51