MoneyGram 2011 Annual Report Download - page 37
Download and view the complete annual report
Please find page 37 of the 2011 MoneyGram annual report below. You can navigate through the pages in the report by either clicking on the pages listed below, or by using the keyword search tool below to find specific information within the annual report.-
 1
1 -
2
-
3
-
4
-
5
-
6
-
7
-
8
-
9
-
10
-
11
-
12
-
13
-
14
-
15
-
16
-
17
-
18
-
19
-
20
-
21
-
22
-
23
-
24
-
25
-
26
-
 27
27 -
 28
28 -
 29
29 -
 30
30 -
 31
31 -
 32
32 -
 33
33 -
 34
34 -
 35
35 -
 36
36 -
 37
37 -
 38
38 -
 39
39 -
 40
40 -
 41
41 -
 42
42 -
 43
43 -
 44
44 -
 45
45 -
 46
46 -
 47
47 -
48
-
49
-
50
-
51
-
52
-
53
-
54
-
55
-
56
-
57
-
58
-
59
-
60
-
61
-
62
-
63
-
64
-
65
-
66
-
67
-
68
-
69
-
70
-
71
-
72
-
73
-
74
-
75
-
76
-
77
-
78
-
79
-
80
-
81
-
82
-
83
-
84
-
85
-
86
-
87
-
88
-
89
-
90
-
91
-
92
-
93
-
94
-
95
-
96
-
97
-
98
-
99
-
100
-
101
-
102
-
103
-
104
-
105
-
106
-
107
-
108
-
109
-
110
-
111
-
112
-
113
-
114
-
115
-
116
-
117
-
118
-
119
-
120
-
121
-
122
-
123
-
124
-
125
-
126
-
127
-
128
-
129
-
130
-
131
-
132
-
133
-
134
-
135
-
136
-
137
-
138
-
139
-
140
-
141
-
142
-
143
-
144
-
145
-
146
-
147
-
148
-
149
-
150
-
151
-
152
-
153
-
154
-
155
-
156
-
157
-
158
-
159
-
160
-
161
-
162
-
163
-
164
-
165
-
166
-
167
-
168
-
169
-
170
-
171
-
172
-
173
-
174
-
175
-
176
-
177
-
178
-
179
-
180
-
181
-
182
-
183
-
184
-
185
-
186
-
187
-
188
-
189
-
190
-
191
-
192
-
193
-
194
-
195
-
196
-
197
-
198
-
199
-
200
-
201
-
202
-
203
-
204
-
205
-
206
-
207
-
208
-
209
-
210
-
211
-
212
-
213
-
214
-
215
-
216
-
217
-
218
-
219
-
220
-
221
-
222
-
223
-
224
-
225
-
226
-
227
-
228
-
229
-
230
-
231
-
232
-
233
-
234
-
235
-
236
-
237
-
238
-
239
-
240
-
241
-
242
-
243
-
244
-
245
-
246
-
247
-
248
-
249
 |
 |

Table of Contents
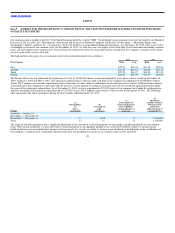
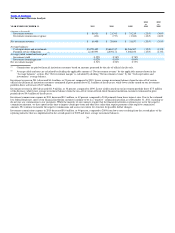
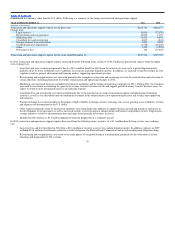
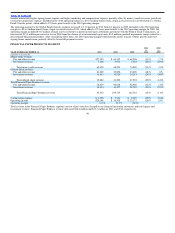
Net Investment Revenue Analysis
2011 2010
vs. vs.
YEAR ENDED DECEMBER 31, 2011 2010 2009 2010 2009
(Amounts in thousands)
Investment revenue $ 16,911 $ 21,341 $ 33,219 (21)% (36)%
Investment commissions expense (431) (737) (1,362) (42)% (46)%
Net investment revenue $ 16,480 $ 20,604 $ 31,857 (20)% (35)%
Average balances:
Cash equivalents and investments $3,255,405 $3,684,317 $4,246,507 (12)% (13)%
Payment service obligations 2,310,993 2,659,171 3,048,100 (13)% (13)%
Average yields earned and rates paid (1):
Investment yield 0.52% 0.58% 0.78%
Investment commission rate 0.02% 0.03% 0.04%
Net investment margin(2) 0.51% 0.56% 0.75%
(1) Commissions are paid to financial institution customers based on amounts generated by the sale of official checks only.
(2) Average yields and rates are calculated by dividing the applicable amount of “Net investment revenue” by the applicable amount shown in the
“Average balances” section. The “Net investment margin” is calculated by dividing “Net investment revenue” by the “Cash equivalents and
investments” average balance.
Investment revenue in 2011 decreased $4.4 million, or 21 percent, compared to 2010. Lower average investment balances from the run−off of certain
official check financial institution customers terminated in prior periods drove $2.5 million of the decrease, while lower yields earned on our investment
portfolio drove a decrease of $1.9 million.
Investment revenue in 2010 decreased $11.9 million, or 36 percent, compared to 2009. Lower yields earned on our investment portfolio drove $7.5 million
of the decrease, while lower average investment balances from the run−off of certain official check financial institution customers terminated in prior
periods drove $4.4 million of the decrease.
Investment commissions expense in 2011 decreased $0.3 million, or 42 percent, compared to 2010 primarily from lower interest rates. Due to the sustained
low federal funds rate, most of our financial institution customers continue to be in a “negative” commission position as of December 31, 2011, meaning we
do not owe any commissions to our customers. While the majority of our contracts require that the financial institution customers pay us for the negative
commission amounts, we have opted at this time to impose certain per−item and other fees rather than require payment of the negative commission
amounts. We continue to monitor the negative commissions and assess our current fee structure for possible further changes.
Investment commissions expense in 2010 decreased $0.6 million, or 46 percent, compared to 2009 from lower rates resulting from the second phase of the
repricing initiative that was implemented in the second quarter of 2009 and lower average investment balances.
36