MoneyGram 2011 Annual Report Download - page 44
Download and view the complete annual report
Please find page 44 of the 2011 MoneyGram annual report below. You can navigate through the pages in the report by either clicking on the pages listed below, or by using the keyword search tool below to find specific information within the annual report.-
 1
1 -
2
-
3
-
4
-
5
-
6
-
7
-
8
-
9
-
10
-
11
-
12
-
13
-
14
-
15
-
16
-
17
-
18
-
19
-
20
-
21
-
22
-
23
-
24
-
25
-
26
-
27
-
28
-
29
-
30
-
31
-
32
-
33
-
 34
34 -
 35
35 -
 36
36 -
 37
37 -
 38
38 -
 39
39 -
 40
40 -
 41
41 -
 42
42 -
 43
43 -
 44
44 -
 45
45 -
 46
46 -
 47
47 -
 48
48 -
 49
49 -
 50
50 -
 51
51 -
 52
52 -
 53
53 -
 54
54 -
55
-
56
-
57
-
58
-
59
-
60
-
61
-
62
-
63
-
64
-
65
-
66
-
67
-
68
-
69
-
70
-
71
-
72
-
73
-
74
-
75
-
76
-
77
-
78
-
79
-
80
-
81
-
82
-
83
-
84
-
85
-
86
-
87
-
88
-
89
-
90
-
91
-
92
-
93
-
94
-
95
-
96
-
97
-
98
-
99
-
100
-
101
-
102
-
103
-
104
-
105
-
106
-
107
-
108
-
109
-
110
-
111
-
112
-
113
-
114
-
115
-
116
-
117
-
118
-
119
-
120
-
121
-
122
-
123
-
124
-
125
-
126
-
127
-
128
-
129
-
130
-
131
-
132
-
133
-
134
-
135
-
136
-
137
-
138
-
139
-
140
-
141
-
142
-
143
-
144
-
145
-
146
-
147
-
148
-
149
-
150
-
151
-
152
-
153
-
154
-
155
-
156
-
157
-
158
-
159
-
160
-
161
-
162
-
163
-
164
-
165
-
166
-
167
-
168
-
169
-
170
-
171
-
172
-
173
-
174
-
175
-
176
-
177
-
178
-
179
-
180
-
181
-
182
-
183
-
184
-
185
-
186
-
187
-
188
-
189
-
190
-
191
-
192
-
193
-
194
-
195
-
196
-
197
-
198
-
199
-
200
-
201
-
202
-
203
-
204
-
205
-
206
-
207
-
208
-
209
-
210
-
211
-
212
-
213
-
214
-
215
-
216
-
217
-
218
-
219
-
220
-
221
-
222
-
223
-
224
-
225
-
226
-
227
-
228
-
229
-
230
-
231
-
232
-
233
-
234
-
235
-
236
-
237
-
238
-
239
-
240
-
241
-
242
-
243
-
244
-
245
-
246
-
247
-
248
-
249
 |
 |

Table of Contents
over portfolio investment decisions. While the derivatives portfolio is also managed on a consolidated level, each derivative instrument is utilized in a
manner that can be identified to a particular segment. Interest rate swaps historically used to hedge variable rate commissions were identified with the
official check product in the Financial Paper Products segment, while forward foreign exchange contracts are identified with the money transfer product in
the Global Funds Transfer segment. Any interest rate swaps related to our credit agreements are not allocated to the segments.
Also excluded from operating income for Global Funds Transfer and Financial Paper Products are interest and other expenses related to our credit
agreements, items related to our preferred stock, operating income from businesses categorized as “Other,” certain pension and benefit obligation expenses,
director deferred compensation plan expenses, executive severance and related costs and certain legal and corporate costs not related to the performance of
the segments.
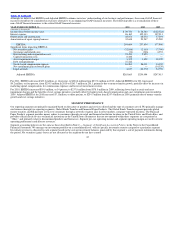
Unallocated expenses in 2011 include $9.5 million of corporate costs and $0.4 million of costs associated with our global transformation initiative. In 2010,
unallocated expenses include $7.4 million of corporate costs, $5.9 million of costs associated with our global transformation initiative and $1.8 million of
asset impairments.
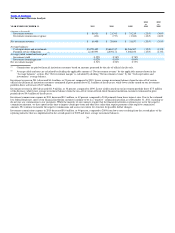
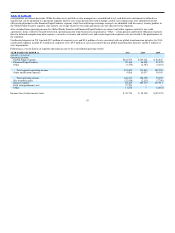
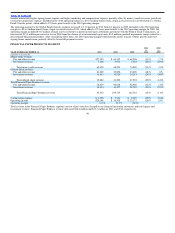
Following is a reconciliation of segment operating income to the consolidated operating results:
YEAR ENDED DECEMBER 31, 2011 2010 2009
(Amounts in thousands)
Operating income:
Global Funds Transfer $124,793 $139,314 $ 82,647
Financial Paper Products 29,168 36,508 27,372
Other (1,556) (2,367) (4,316)
Total segment operating income 152,405 173,455 105,703
Other unallocated expenses 9,888 15,057 30,305
Total operating income 142,517 158,398 75,398
Net securities gains (32,816) (2,115) (7,790)
Interest expense 86,165 102,133 107,911
Debt extinguishment costs 37,522 — —
Other 11,876 — (2,401)
Income (loss) before income taxes $ 39,770 $ 58,380 $ (22,322)
43