MoneyGram 2011 Annual Report Download - page 102
Download and view the complete annual report
Please find page 102 of the 2011 MoneyGram annual report below. You can navigate through the pages in the report by either clicking on the pages listed below, or by using the keyword search tool below to find specific information within the annual report.-
 1
1 -
2
-
3
-
4
-
5
-
6
-
7
-
8
-
9
-
10
-
11
-
12
-
13
-
14
-
15
-
16
-
17
-
18
-
19
-
20
-
21
-
22
-
23
-
24
-
25
-
26
-
27
-
28
-
29
-
30
-
31
-
32
-
33
-
34
-
35
-
36
-
37
-
38
-
39
-
40
-
41
-
42
-
43
-
44
-
45
-
46
-
47
-
48
-
49
-
50
-
51
-
52
-
53
-
54
-
55
-
56
-
57
-
58
-
59
-
60
-
61
-
62
-
63
-
64
-
65
-
66
-
67
-
68
-
69
-
70
-
71
-
72
-
73
-
74
-
75
-
76
-
77
-
78
-
79
-
80
-
81
-
82
-
83
-
84
-
85
-
86
-
87
-
88
-
89
-
90
-
91
-
 92
92 -
 93
93 -
 94
94 -
 95
95 -
 96
96 -
 97
97 -
 98
98 -
 99
99 -
 100
100 -
 101
101 -
 102
102 -
 103
103 -
 104
104 -
 105
105 -
 106
106 -
 107
107 -
 108
108 -
 109
109 -
 110
110 -
 111
111 -
 112
112 -
113
-
114
-
115
-
116
-
117
-
118
-
119
-
120
-
121
-
122
-
123
-
124
-
125
-
126
-
127
-
128
-
129
-
130
-
131
-
132
-
133
-
134
-
135
-
136
-
137
-
138
-
139
-
140
-
141
-
142
-
143
-
144
-
145
-
146
-
147
-
148
-
149
-
150
-
151
-
152
-
153
-
154
-
155
-
156
-
157
-
158
-
159
-
160
-
161
-
162
-
163
-
164
-
165
-
166
-
167
-
168
-
169
-
170
-
171
-
172
-
173
-
174
-
175
-
176
-
177
-
178
-
179
-
180
-
181
-
182
-
183
-
184
-
185
-
186
-
187
-
188
-
189
-
190
-
191
-
192
-
193
-
194
-
195
-
196
-
197
-
198
-
199
-
200
-
201
-
202
-
203
-
204
-
205
-
206
-
207
-
208
-
209
-
210
-
211
-
212
-
213
-
214
-
215
-
216
-
217
-
218
-
219
-
220
-
221
-
222
-
223
-
224
-
225
-
226
-
227
-
228
-
229
-
230
-
231
-
232
-
233
-
234
-
235
-
236
-
237
-
238
-
239
-
240
-
241
-
242
-
243
-
244
-
245
-
246
-
247
-
248
-
249
 |
 |

Table of Contents
The operating results of Blue Dolphin subsequent to the acquisition date are included in the Company’s Consolidated Statements of Income (Loss). The
financial impact of the acquisition is not material to the Consolidated Balance Sheets or Consolidated Statements of Income (Loss).
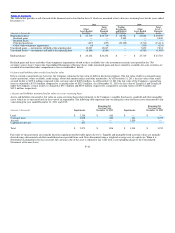
R. Raphaels & Sons PLC — On February 2, 2009, the Company acquired the French assets of R. Raphaels & Sons PLC (“Raphaels Bank”) for a purchase
price of $3.2 million. The acquisition of Raphaels Bank provided the Company with five money transfer stores in and around Paris, France that have been
integrated into its French retail operations.
The Company finalized its purchase price allocation in 2010, resulting in $2.0 million of goodwill assigned to the Company’s Global Funds Transfer
segment. The Company incurred $0.2 million of transaction costs related to this acquisition in 2008 which are included in the “Transaction and operations
support” line in the Consolidated Statements of Income (Loss). The operating results of Raphaels Bank subsequent to the acquisition date are included in the
Company’s Consolidated Statements of Income (Loss). The financial impact of the acquisition is not material to the Consolidated Balance Sheets or
Consolidated Statements of Income (Loss).
FSMC, Inc. — On May 15, 2009, the Company’s subsidiary FSMC, Inc. (“FSMC”), entered into an agreement with Solutran, Inc. to sell certain assets and
rights for a price of $4.5 million. As a result of the sale, which was completed in the third quarter of 2009, the Company recorded an impairment charge of
$0.6 million to write off goodwill associated with FSMC. This impairment charge is recorded in the “Transaction and operations support” line in the
Consolidated Statements of Income (Loss). The operating results of FSMC are not material to the Company’s Consolidated Statements of Income (Loss)
and the assets and liabilities are not material to the Company’s Consolidated Balance Sheets. FSMC is included in the Company’s “Other” results for
segment reporting purposes.
ACH Commerce — After evaluating the Company’s market opportunity for certain of its electronic payment services, the Company announced a decision in
December 2008 to exit the ACH Commerce business. In connection with this decision, the Company recognized an impairment charge of $8.8 million to
write off the goodwill associated with ACH Commerce. In the third quarter of 2009, the Company recorded an impairment charge of $1.4 million for its
proprietary software related to ACH Commerce. The impairment charge was recorded in the “Transaction and operations support” line in the Consolidated
Statements of Income (Loss). ACH Commerce is not material to the Consolidated Statements of Income (Loss) or the Consolidated Balance Sheets. ACH
Commerce is included in the Company’s “Other” results for segment reporting purposes.
Other Disposals — During 2010, the Company completed the sale of its corporate airplane with net proceeds of $7.5 million. Upon completion of the sale
in the third quarter of 2010 the Company recorded an impairment charge of $1.5 million. In 2009, in connection with this decision to sell the airplane, the
Company recognized a $7.0 million impairment charge. Impairment charges are recorded in the “Transaction and operations support” line in the
Consolidated Statements of Income (Loss).
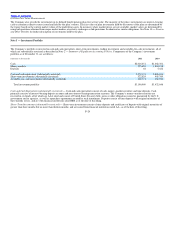
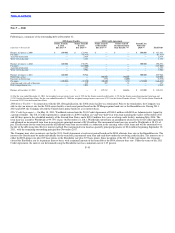
Note 4 — Fair Value Measurement
Fair value is defined as the exchange price that would be received for an asset or paid to transfer a liability, or the exit price, in an orderly transaction
between market participants on the measurement date. A three−level hierarchy is used for fair value measurements based upon the observability of the
inputs to the valuation of an asset or liability as of the measurement date. Under the hierarchy, the highest priority is given to unadjusted quoted prices in
active markets for identical assets or liabilities (Level 1), followed by observable inputs (Level 2) and unobservable inputs (Level 3). A financial
instrument’s level within the hierarchy is based on the lowest level of any input that is significant to the fair value measurement. Following is a description
of the Company’s valuation methodologies used to estimate the fair value for assets and liabilities:
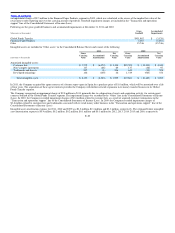
a) Assets and liabilities that are measured at fair value on a recurring basis
•Available−for−sale Investments — For U.S. government agencies and residential mortgage−backed securities collateralized by U.S. government
agency securities, fair value measures are generally obtained
F−20