MoneyGram 2011 Annual Report Download - page 36
Download and view the complete annual report
Please find page 36 of the 2011 MoneyGram annual report below. You can navigate through the pages in the report by either clicking on the pages listed below, or by using the keyword search tool below to find specific information within the annual report.-
 1
1 -
2
-
3
-
4
-
5
-
6
-
7
-
8
-
9
-
10
-
11
-
12
-
13
-
14
-
15
-
16
-
17
-
18
-
19
-
20
-
21
-
22
-
23
-
24
-
25
-
 26
26 -
 27
27 -
 28
28 -
 29
29 -
 30
30 -
 31
31 -
 32
32 -
 33
33 -
 34
34 -
 35
35 -
 36
36 -
 37
37 -
 38
38 -
 39
39 -
 40
40 -
 41
41 -
 42
42 -
 43
43 -
 44
44 -
 45
45 -
 46
46 -
47
-
48
-
49
-
50
-
51
-
52
-
53
-
54
-
55
-
56
-
57
-
58
-
59
-
60
-
61
-
62
-
63
-
64
-
65
-
66
-
67
-
68
-
69
-
70
-
71
-
72
-
73
-
74
-
75
-
76
-
77
-
78
-
79
-
80
-
81
-
82
-
83
-
84
-
85
-
86
-
87
-
88
-
89
-
90
-
91
-
92
-
93
-
94
-
95
-
96
-
97
-
98
-
99
-
100
-
101
-
102
-
103
-
104
-
105
-
106
-
107
-
108
-
109
-
110
-
111
-
112
-
113
-
114
-
115
-
116
-
117
-
118
-
119
-
120
-
121
-
122
-
123
-
124
-
125
-
126
-
127
-
128
-
129
-
130
-
131
-
132
-
133
-
134
-
135
-
136
-
137
-
138
-
139
-
140
-
141
-
142
-
143
-
144
-
145
-
146
-
147
-
148
-
149
-
150
-
151
-
152
-
153
-
154
-
155
-
156
-
157
-
158
-
159
-
160
-
161
-
162
-
163
-
164
-
165
-
166
-
167
-
168
-
169
-
170
-
171
-
172
-
173
-
174
-
175
-
176
-
177
-
178
-
179
-
180
-
181
-
182
-
183
-
184
-
185
-
186
-
187
-
188
-
189
-
190
-
191
-
192
-
193
-
194
-
195
-
196
-
197
-
198
-
199
-
200
-
201
-
202
-
203
-
204
-
205
-
206
-
207
-
208
-
209
-
210
-
211
-
212
-
213
-
214
-
215
-
216
-
217
-
218
-
219
-
220
-
221
-
222
-
223
-
224
-
225
-
226
-
227
-
228
-
229
-
230
-
231
-
232
-
233
-
234
-
235
-
236
-
237
-
238
-
239
-
240
-
241
-
242
-
243
-
244
-
245
-
246
-
247
-
248
-
249
 |
 |

Table of Contents
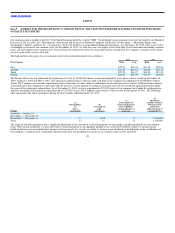
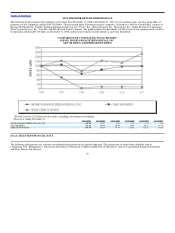
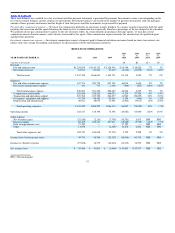
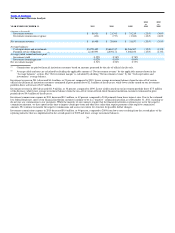
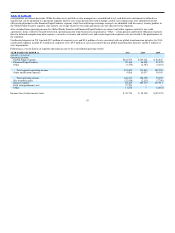
FEE AND OTHER REVENUE AND COMMISSIONS EXPENSE
The following discussion provides a summary overview of results. See discussion for the Global Funds Transfer and Financial Paper Products segments for
more detailed explanations of our results.
2011 2010
vs. vs.
YEAR ENDED DECEMBER 31, 2011 2010 2009 2010 2009
(Amounts in thousands)
Fee and other revenue $1,230,858 $1,145,312 $1,128,492 7% 1%
Fee and other commissions expense 547,573 500,759 497,105 9% 1%
Fee and other commissions expense as a % of fee and other revenue 44.5% 43.7% 44.1%
Fee and Other Revenue
In 2011, fee and other revenue growth of $85.5 million, or seven percent, was primarily driven by money transfer transaction volume growth, a higher euro
exchange rate and higher foreign exchange revenue, partially offset by changes in corridor mix, lower average face value per transaction and the $50 price
band in the United States. Bill payment products, money order and official check fee and other revenue decreased due to volume declines.
In 2010, fee and other revenue growth of $16.8 million, or one percent, was primarily driven by money transfer transaction volume growth, changes in
corridor mix and higher foreign exchange revenue, partially offset by a lower euro exchange rate and the introduction of the $50 price band in the United
States. Official check fee and other revenue increased from repricing initiatives, partially offset by the run−off of financial institution customers. Bill
payment products and money order fee and other revenue decreased from volume declines, with bill payment products also being adversely impacted by
lower average fees per transaction due to industry mix.
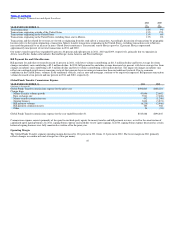
Fee and Other Commissions
In 2011, fee and other commissions expense growth of $46.8 million, or nine percent, was primarily due to money transfer volume growth, a higher euro
exchange rate and increased signing bonus amortization, partially offset by lower bill payment and money order volumes. Signing bonus amortization
increased due to the signing of new agents. Commissions expense grew at a faster rate than revenue due to pay−out at a higher tier level from volume
growth for certain key agents and corridor mix. Commissions expense as a percent of fee and other revenue increased to 44.5 percent in 2011 from 43.7
percent in 2010, primarily from the continued shift in overall product mix towards the Global Funds Transfer segment, particularly the money transfer
product. Agents in the Global Funds Transfer segment are compensated through commissions we pay to them, whereas our Financial Paper Products agents
and financial institution customers primarily earn their revenue through per item fees they charge directly to the consumer.
In 2010, fee and other commissions expense growth of $3.7 million, or one percent, was primarily due to money transfer transaction volume growth,
partially offset by a lower euro exchange rate, a decrease in signing bonus amortization, lower average money transfer commission rates, declines in
volumes for bill payment, money order and official check, and lower average bill payment fees from changes in industry mix. Signing bonus amortization
decreased as certain historical signing bonuses were fully amortized in the prior year. Commissions expense as a percent of fee and other revenue increased
to 43.7 percent in 2010 from 44.1 percent in 2009, primarily from the continued shift in overall product mix towards the Global Funds Transfer segment,
particularly the money transfer product.
35