MoneyGram 2011 Annual Report Download - page 110
Download and view the complete annual report
Please find page 110 of the 2011 MoneyGram annual report below. You can navigate through the pages in the report by either clicking on the pages listed below, or by using the keyword search tool below to find specific information within the annual report.-
 1
1 -
2
-
3
-
4
-
5
-
6
-
7
-
8
-
9
-
10
-
11
-
12
-
13
-
14
-
15
-
16
-
17
-
18
-
19
-
20
-
21
-
22
-
23
-
24
-
25
-
26
-
27
-
28
-
29
-
30
-
31
-
32
-
33
-
34
-
35
-
36
-
37
-
38
-
39
-
40
-
41
-
42
-
43
-
44
-
45
-
46
-
47
-
48
-
49
-
50
-
51
-
52
-
53
-
54
-
55
-
56
-
57
-
58
-
59
-
60
-
61
-
62
-
63
-
64
-
65
-
66
-
67
-
68
-
69
-
70
-
71
-
72
-
73
-
74
-
75
-
76
-
77
-
78
-
79
-
80
-
81
-
82
-
83
-
84
-
85
-
86
-
87
-
88
-
89
-
90
-
91
-
92
-
93
-
94
-
95
-
96
-
97
-
98
-
99
-
 100
100 -
 101
101 -
 102
102 -
 103
103 -
 104
104 -
 105
105 -
 106
106 -
 107
107 -
 108
108 -
 109
109 -
 110
110 -
 111
111 -
 112
112 -
 113
113 -
 114
114 -
 115
115 -
 116
116 -
 117
117 -
 118
118 -
 119
119 -
 120
120 -
121
-
122
-
123
-
124
-
125
-
126
-
127
-
128
-
129
-
130
-
131
-
132
-
133
-
134
-
135
-
136
-
137
-
138
-
139
-
140
-
141
-
142
-
143
-
144
-
145
-
146
-
147
-
148
-
149
-
150
-
151
-
152
-
153
-
154
-
155
-
156
-
157
-
158
-
159
-
160
-
161
-
162
-
163
-
164
-
165
-
166
-
167
-
168
-
169
-
170
-
171
-
172
-
173
-
174
-
175
-
176
-
177
-
178
-
179
-
180
-
181
-
182
-
183
-
184
-
185
-
186
-
187
-
188
-
189
-
190
-
191
-
192
-
193
-
194
-
195
-
196
-
197
-
198
-
199
-
200
-
201
-
202
-
203
-
204
-
205
-
206
-
207
-
208
-
209
-
210
-
211
-
212
-
213
-
214
-
215
-
216
-
217
-
218
-
219
-
220
-
221
-
222
-
223
-
224
-
225
-
226
-
227
-
228
-
229
-
230
-
231
-
232
-
233
-
234
-
235
-
236
-
237
-
238
-
239
-
240
-
241
-
242
-
243
-
244
-
245
-
246
-
247
-
248
-
249
 |
 |

Table of Contents
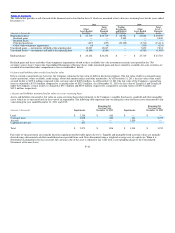
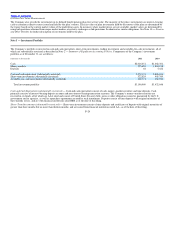
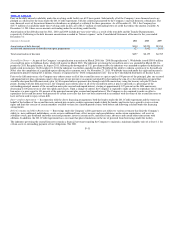
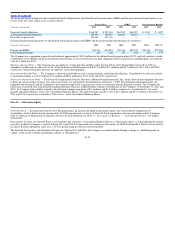
Depreciation expense for the year ended December 31 is as follows:
(Amounts in thousands) 2011 2010 2009
Computer hardware and software $21,064 $20,314 $23,351
Signage 9,616 8,688 10,891
Agent equipment 6,469 8,989 11,449
Office furniture and equipment 3,962 3,772 4,600
Leasehold improvements 3,744 3,885 3,526
Total depreciation expense $44,855 $45,648 $53,817
At December 31, 2011 and 2010, there was $9.9 million and $3.9 million, respectively, of property and equipment that had been received by the Company
and included in “Accounts payable and other liabilities” in the Consolidated Balance Sheets.
Following its decision to sell land in 2011, the Company recognized a $2.4 million impairment charge. During 2011, the Company also recognized a $0.7
million capitalized software impairment charge, primarily in connection with the disposition of assets in the Global Funds Transfer segment. The
impairment charges recorded in 2011 were included in the “Other” line in the Consolidated Statements of Income (Loss).
In connection with its decision to sell its corporate airplane, the Company recognized a $7.0 million impairment charge in 2009 and a $1.5 million
impairment charge in 2010. The sale was completed in the third quarter of 2010. In 2009, the Company fully impaired $1.4 million of software related to its
ACH Commerce business based on changes in its exit plan. The impairment charges recorded in 2010 and 2009 were included in the “Transaction and
operations support” line in the Consolidated Statements of Income (Loss).
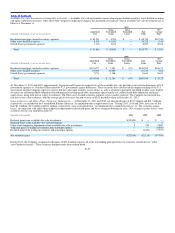
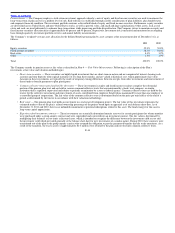
Note 8 — Goodwill and Intangible Assets
Following is a roll−forward of goodwill by reporting segment:
(Amounts in thousands) Global Funds
Transfer Financial
Paper Products Other Total
Balance as of January 1, 2009 $ 426,794 $ 2,487 $ 5,056 $434,337
Acquisitions 2,012 — — 2,012
Impairment charge (3,176) (2,487) (582) (6,245)
Divestitures — — (4,474) (4,474)
Balance as of December 31, 2009 $ 425,630 $ — $ — $425,630
Acquisitions 3,061 — — 3,061
Balance as of December 31, 2010 $ 428,691 $ — $ — $428,691
Balance as of December 31, 2011 $ 428,691 $ — $ — $428,691
Goodwill acquired in 2010 relates to the acquisition of Blue Dolphin which is a component of the Global Funds Transfer segment and is not deductible for
tax purposes.
The Company impaired $3.2 million of goodwill in 2009 allocated to the Global Funds Transfer segment associated with a decision to discontinue certain
bill payment product offerings. In connection with the sale of FSMC in 2009, the Company recorded a charge of $0.6 million to impair goodwill that was in
excess of the final sale price. In addition, goodwill was reduced by $4.5 million from the sale of FSMC. The FSMC reporting unit was not a component of
the Global Funds Transfer or Financial Paper Products segments.
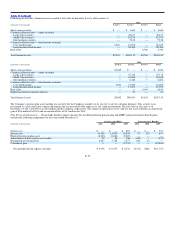
The Company performed an annual assessment of goodwill during the fourth quarters of 2011, 2010 and 2009. As a result of the 2009 annual assessment, it
was determined that the fair value of the retail money order reporting unit, a component of the Financial Paper Products segment, was fully impaired. The
Company recorded
F−28