MoneyGram 2011 Annual Report Download - page 125
Download and view the complete annual report
Please find page 125 of the 2011 MoneyGram annual report below. You can navigate through the pages in the report by either clicking on the pages listed below, or by using the keyword search tool below to find specific information within the annual report.-
 1
1 -
2
-
3
-
4
-
5
-
6
-
7
-
8
-
9
-
10
-
11
-
12
-
13
-
14
-
15
-
16
-
17
-
18
-
19
-
20
-
21
-
22
-
23
-
24
-
25
-
26
-
27
-
28
-
29
-
30
-
31
-
32
-
33
-
34
-
35
-
36
-
37
-
38
-
39
-
40
-
41
-
42
-
43
-
44
-
45
-
46
-
47
-
48
-
49
-
50
-
51
-
52
-
53
-
54
-
55
-
56
-
57
-
58
-
59
-
60
-
61
-
62
-
63
-
64
-
65
-
66
-
67
-
68
-
69
-
70
-
71
-
72
-
73
-
74
-
75
-
76
-
77
-
78
-
79
-
80
-
81
-
82
-
83
-
84
-
85
-
86
-
87
-
88
-
89
-
90
-
91
-
92
-
93
-
94
-
95
-
96
-
97
-
98
-
99
-
100
-
101
-
102
-
103
-
104
-
105
-
106
-
107
-
108
-
109
-
110
-
111
-
112
-
113
-
114
-
 115
115 -
 116
116 -
 117
117 -
 118
118 -
 119
119 -
 120
120 -
 121
121 -
 122
122 -
 123
123 -
 124
124 -
 125
125 -
 126
126 -
 127
127 -
 128
128 -
 129
129 -
 130
130 -
 131
131 -
 132
132 -
 133
133 -
 134
134 -
 135
135 -
136
-
137
-
138
-
139
-
140
-
141
-
142
-
143
-
144
-
145
-
146
-
147
-
148
-
149
-
150
-
151
-
152
-
153
-
154
-
155
-
156
-
157
-
158
-
159
-
160
-
161
-
162
-
163
-
164
-
165
-
166
-
167
-
168
-
169
-
170
-
171
-
172
-
173
-
174
-
175
-
176
-
177
-
178
-
179
-
180
-
181
-
182
-
183
-
184
-
185
-
186
-
187
-
188
-
189
-
190
-
191
-
192
-
193
-
194
-
195
-
196
-
197
-
198
-
199
-
200
-
201
-
202
-
203
-
204
-
205
-
206
-
207
-
208
-
209
-
210
-
211
-
212
-
213
-
214
-
215
-
216
-
217
-
218
-
219
-
220
-
221
-
222
-
223
-
224
-
225
-
226
-
227
-
228
-
229
-
230
-
231
-
232
-
233
-
234
-
235
-
236
-
237
-
238
-
239
-
240
-
241
-
242
-
243
-
244
-
245
-
246
-
247
-
248
-
249
 |
 |

Table of Contents
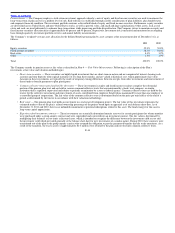
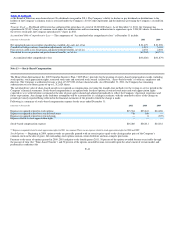
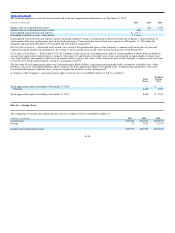
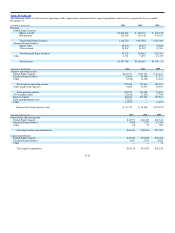
The following represents stock option compensation information as of December 31, 2011:
(Amounts in thousands) 2011 2010 2009
Intrinsic value of options exercised $ 221,937 $1,263 $ —
Cash received from option exercises $ 716 $2,031 $—
Unrecognized stock option expense $ 24,397
Remaining weighted−average vesting period 1.6 years
Restricted Stock Units — In the fourth quarter of 2011, the Company issued a grant of performance−based restricted stock units to certain employees which
will vest and become payable in shares to the extent the Company attains the performance goals applicable to the performance period. The performance goal
is based on the degree to which the Company’s average annual adjusted EBITDA, defined as earnings before interest, taxes, depreciation and amortization
and less certain non−recurring or other unexpected expenses, meets, exceeds or falls short of the target performance goal of achieving an average annual
adjusted EBITDA increase of 10 percent over a three year period. Under the terms of the grant, 50 percent of the target restricted stock units may vest on the
second anniversary if the performance goal is achieved as of that date. The number of restricted stock units that vest is determined on a pro rata basis by the
extent to which the performance goal is met within a threshold minimum and maximum. In the event the target performance goal is not met, but the
Company achieves a minimum performance goal of an average annual adjusted EBITDA growth of five percent, the participant will be entitled to vest in 50
percent of the target number of restricted stock units. In the event the Company achieves its maximum performance goal of an average annual adjusted
EBITDA growth of 20 percent, the participant will be entitled to 200 percent of the target number of restricted stock units.
In 2011 and 2010, the Company granted time−based restricted stock units to members of the Board of Directors, excluding the Chairman of the Board, as
compensation for services to be provided. The restricted stock units vest on the first anniversary of their issuance and may only be settled in the Company’s
common stock.
The fair value of restricted stock units is calculated based on the stock price at the time of grant. For performance based restricted stock units, expense is
recognized if achievement of the performance goal is deemed probable, with the amount of expense recognized based on the Company’s best estimate of the
ultimate achievement level. For the 2011 performance based restricted stock units, the grant date fair value at the minimum, target and maximum thresholds
is $1.4 million, $2.7 million and $5.4 million, respectively. As of December 31, 2011, the Company believes it is probable it will achieve the performance
goal at the target level on the third anniversary. For grants to employees, expense is recognized in the “Compensation and benefits” line and expense for
grants to Directors is recorded in the “Transaction and operations support” line in the Consolidated Statements of Income using the straight−line method
over the vesting period.
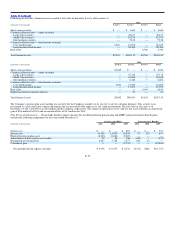
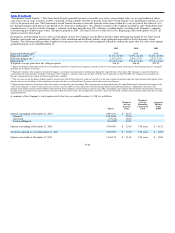
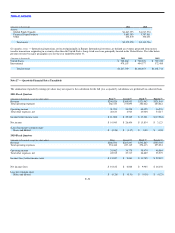
A summary of the Company’s restricted stock unit activity for the year ended December 31, 2011 is as follows:
Weighted
Total Average
Shares Price
Restricted stock units outstanding at December 31, 2010 27,984 $ 21.44
Granted 339,036 17.77
Vested (27,984) 21.44
Forfeited (1,360) 17.03
Restricted stock units outstanding at December 31, 2011 337,676 $ 17.77
F−43