MoneyGram 2011 Annual Report Download - page 97
Download and view the complete annual report
Please find page 97 of the 2011 MoneyGram annual report below. You can navigate through the pages in the report by either clicking on the pages listed below, or by using the keyword search tool below to find specific information within the annual report.-
 1
1 -
2
-
3
-
4
-
5
-
6
-
7
-
8
-
9
-
10
-
11
-
12
-
13
-
14
-
15
-
16
-
17
-
18
-
19
-
20
-
21
-
22
-
23
-
24
-
25
-
26
-
27
-
28
-
29
-
30
-
31
-
32
-
33
-
34
-
35
-
36
-
37
-
38
-
39
-
40
-
41
-
42
-
43
-
44
-
45
-
46
-
47
-
48
-
49
-
50
-
51
-
52
-
53
-
54
-
55
-
56
-
57
-
58
-
59
-
60
-
61
-
62
-
63
-
64
-
65
-
66
-
67
-
68
-
69
-
70
-
71
-
72
-
73
-
74
-
75
-
76
-
77
-
78
-
79
-
80
-
81
-
82
-
83
-
84
-
85
-
86
-
 87
87 -
 88
88 -
 89
89 -
 90
90 -
 91
91 -
 92
92 -
 93
93 -
 94
94 -
 95
95 -
 96
96 -
 97
97 -
 98
98 -
 99
99 -
 100
100 -
 101
101 -
 102
102 -
 103
103 -
 104
104 -
 105
105 -
 106
106 -
 107
107 -
108
-
109
-
110
-
111
-
112
-
113
-
114
-
115
-
116
-
117
-
118
-
119
-
120
-
121
-
122
-
123
-
124
-
125
-
126
-
127
-
128
-
129
-
130
-
131
-
132
-
133
-
134
-
135
-
136
-
137
-
138
-
139
-
140
-
141
-
142
-
143
-
144
-
145
-
146
-
147
-
148
-
149
-
150
-
151
-
152
-
153
-
154
-
155
-
156
-
157
-
158
-
159
-
160
-
161
-
162
-
163
-
164
-
165
-
166
-
167
-
168
-
169
-
170
-
171
-
172
-
173
-
174
-
175
-
176
-
177
-
178
-
179
-
180
-
181
-
182
-
183
-
184
-
185
-
186
-
187
-
188
-
189
-
190
-
191
-
192
-
193
-
194
-
195
-
196
-
197
-
198
-
199
-
200
-
201
-
202
-
203
-
204
-
205
-
206
-
207
-
208
-
209
-
210
-
211
-
212
-
213
-
214
-
215
-
216
-
217
-
218
-
219
-
220
-
221
-
222
-
223
-
224
-
225
-
226
-
227
-
228
-
229
-
230
-
231
-
232
-
233
-
234
-
235
-
236
-
237
-
238
-
239
-
240
-
241
-
242
-
243
-
244
-
245
-
246
-
247
-
248
-
249
 |
 |

Table of Contents
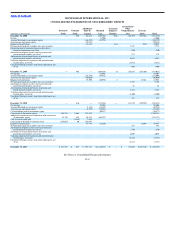
derivative and the resulting designation. For a derivative instrument designated as a fair value hedge, the Company recognizes the change in fair value in
earnings in the period of change, together with the offsetting change in the hedged item.
Cash flows resulting from derivative financial instruments are classified in the same category as the cash flows from the items being hedged. The Company
does not use derivative instruments for trading or speculative purposes.
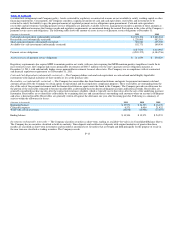
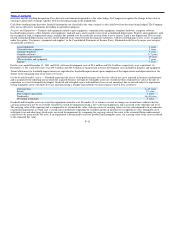
Property and Equipment — Property and equipment includes agent equipment, communication equipment, computer hardware, computer software,
leasehold improvements, office furniture and equipment, land and signs, and is stated at cost net of accumulated depreciation. Property and equipment, with
the exception of land, is depreciated using a straight−line method over the useful life or term of the lease or license. Land is not depreciated. The cost and
related accumulated depreciation of assets sold or disposed of are removed from the financial statements, with the resulting gain or loss, if any, recognized
under the caption “Occupancy, equipment and supplies” in the Consolidated Statements of Income (Loss). Estimated useful lives by major asset category
are generally as follows:
Agent equipment 3 years
Communication equipment 5 years
Computer hardware 3 years
Computer software 5−7 years
Leasehold improvements 10 years
Office furniture and equipment 7 years
Signage 3 years
For the years ended December 31, 2011 and 2010, software development costs of $9.4 million and $14.2 million, respectively, were capitalized. At
December 31, 2011 and 2010, there was $39.3 million and $40.9 million of unamortized software development costs included in property and equipment.
Tenant allowances for leasehold improvements are capitalized as leasehold improvements upon completion of the improvement and depreciated over the
shorter of the remaining term of the lease or 10 years.
Goodwill and Intangible Assets — Goodwill represents the excess of the purchase price over the fair value of net assets acquired in business combinations
and is assigned to the reporting unit in which the acquired business will operate. Intangible assets are recorded at their estimated fair value at the date of
acquisition or at cost if internally developed. Goodwill and intangible assets with indefinite lives are not amortized, but are instead subject to impairment
testing. Intangible assets with finite lives are amortized using a straight−line method over their respective useful lives as follows:
Customer lists 4−15 years
Patents 15 years
Non−compete agreements 3 years
Trademarks 36−40 years
Developed technology 5 years
Goodwill and intangible assets are tested for impairment annually as of November 30, or whenever events or changes in circumstances indicate that the
carrying amount may not be recoverable. Goodwill is tested for impairment using a fair−value based approach, and is assessed at the reporting unit level.
The carrying value of the reporting unit is compared to its estimated fair value, with any excess of carrying value over fair value deemed to be an indicator
of potential impairment, in which case a second step is performed comparing the recorded amount of goodwill to its implied fair value. Intangible assets
with finite lives and other long−lived assets are tested for impairment by comparing the carrying value of the assets to the estimated future undiscounted
cash flows to be generated by the asset. If an impairment is determined to exist for goodwill and intangible assets, the carrying value of the asset is reduced
to the estimated fair value.
F−15