MoneyGram 2011 Annual Report Download - page 42
Download and view the complete annual report
Please find page 42 of the 2011 MoneyGram annual report below. You can navigate through the pages in the report by either clicking on the pages listed below, or by using the keyword search tool below to find specific information within the annual report.-
 1
1 -
2
-
3
-
4
-
5
-
6
-
7
-
8
-
9
-
10
-
11
-
12
-
13
-
14
-
15
-
16
-
17
-
18
-
19
-
20
-
21
-
22
-
23
-
24
-
25
-
26
-
27
-
28
-
29
-
30
-
31
-
 32
32 -
 33
33 -
 34
34 -
 35
35 -
 36
36 -
 37
37 -
 38
38 -
 39
39 -
 40
40 -
 41
41 -
 42
42 -
 43
43 -
 44
44 -
 45
45 -
 46
46 -
 47
47 -
 48
48 -
 49
49 -
 50
50 -
 51
51 -
 52
52 -
53
-
54
-
55
-
56
-
57
-
58
-
59
-
60
-
61
-
62
-
63
-
64
-
65
-
66
-
67
-
68
-
69
-
70
-
71
-
72
-
73
-
74
-
75
-
76
-
77
-
78
-
79
-
80
-
81
-
82
-
83
-
84
-
85
-
86
-
87
-
88
-
89
-
90
-
91
-
92
-
93
-
94
-
95
-
96
-
97
-
98
-
99
-
100
-
101
-
102
-
103
-
104
-
105
-
106
-
107
-
108
-
109
-
110
-
111
-
112
-
113
-
114
-
115
-
116
-
117
-
118
-
119
-
120
-
121
-
122
-
123
-
124
-
125
-
126
-
127
-
128
-
129
-
130
-
131
-
132
-
133
-
134
-
135
-
136
-
137
-
138
-
139
-
140
-
141
-
142
-
143
-
144
-
145
-
146
-
147
-
148
-
149
-
150
-
151
-
152
-
153
-
154
-
155
-
156
-
157
-
158
-
159
-
160
-
161
-
162
-
163
-
164
-
165
-
166
-
167
-
168
-
169
-
170
-
171
-
172
-
173
-
174
-
175
-
176
-
177
-
178
-
179
-
180
-
181
-
182
-
183
-
184
-
185
-
186
-
187
-
188
-
189
-
190
-
191
-
192
-
193
-
194
-
195
-
196
-
197
-
198
-
199
-
200
-
201
-
202
-
203
-
204
-
205
-
206
-
207
-
208
-
209
-
210
-
211
-
212
-
213
-
214
-
215
-
216
-
217
-
218
-
219
-
220
-
221
-
222
-
223
-
224
-
225
-
226
-
227
-
228
-
229
-
230
-
231
-
232
-
233
-
234
-
235
-
236
-
237
-
238
-
239
-
240
-
241
-
242
-
243
-
244
-
245
-
246
-
247
-
248
-
249
 |
 |

Table of Contents
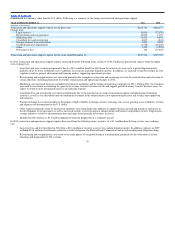
Capital transactions costs relate to the 2011 Recapitalization and the secondary offering. Losses from asset dispositions relate to land sold as part of our
global business transformation and a former bill payment service. Impairment losses relate to land sold and held for sale and intangible assets acquired in
the second quarter of 2011. In 2009, the Company recognized a gain upon maturity of derivative contracts hedging forecasted revenues denominated in
Euro.
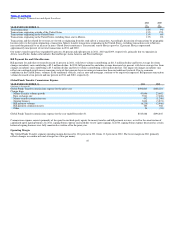
Income taxes — In 2011, the Company recognized a tax benefit of $19.6 million, reflecting benefits of $34.0 million for the reversal of a portion of the
valuation allowance on domestic deferred tax assets and $9.7 million on the sale of assets. Partially offsetting the benefit is tax expense for non−deductible
restructuring expenses and a valuation allowance on a portion of deferred tax assets as a result of losses in certain jurisdictions outside of the United States.
The effective tax rate for 2011 reflects the expected utilization of net tax loss carry−forwards based on the Company’s review of current facts and
circumstances, including the three year cumulative income position and expectations that the Company will maintain a cumulative income position in the
future. Changes in facts and circumstances may cause the Company to record additional tax expense or benefits in the future. Based on current facts and
circumstances, the Company does not anticipate any valuation allowance adjustments that will materially affect the effective rate in 2012.
In 2010, the Company had tax expense of $14.6 million, including the release of $11.9 million of valuation allowances on deferred tax assets in the
U.S. jurisdiction. The decrease in the tax reserve in 2010 was driven by the favorable settlement or closing of years subject to state audit. Reversals and
payments of 2009 legal reserves reduced the tax base on which loss carryovers can be utilized and the corresponding release of valuation allowances.
In 2009, the Company recognized a tax benefit of $20.4 million, primarily reflecting the release of $17.6 million of valuation allowances on deferred tax
assets. Our pre−tax net loss of $22.3 million, when adjusted for our estimated book to tax differences, resulted in taxable income, which allowed us to
release some valuation allowances on our tax loss carryovers. These book to tax differences include impairments on securities and other assets and accruals
related to separated employees, litigation and unrealized foreign exchange losses.
During the second quarter of 2010, the IRS completed its examination of the Company’s consolidated income tax returns for 2005 to 2007, and issued its
Revenue Agent Report, or RAR, challenging the Company’s tax position relating to net securities losses and disallowing the related deductions. The
Company disagrees with the RAR regarding the net securities losses and filed a protest letter. The Company had conferences with the IRS Appeals Office in
2010 and through October 2011, but was unable to reach agreement with the IRS Appeals Division. The Company is also currently under examination for
its 2008 and 2009 tax returns, which had similar deductions. As a result, the Company expects to receive Notices of Deficiency within the next 12 months
disallowing approximately $908.5 million of cumulative deductions taken for net securities losses in its 2007, 2008 and 2009 tax returns. As of
December 31, 2011, the Company has recognized a cumulative benefit of approximately $136.1 million relating to these deductions. If the Notices of
Deficiency contain adjustments with which the Company does not agree, the Company anticipates that it will file a petition in the United States Tax Court
contesting such adjustments. While we believe our position will be sustained, if the Company’s petition is denied in its entirety, the expense the Company
would recognize as of December 31, 2011 is $144.0 million, including any interest. The Company continues to believe that the amounts recorded in its
consolidated financial statements reflect its best estimate of the ultimate outcome of this matter.
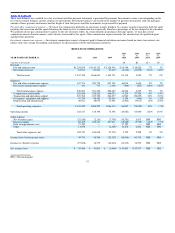
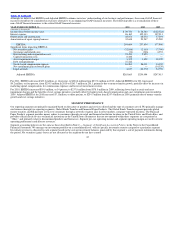
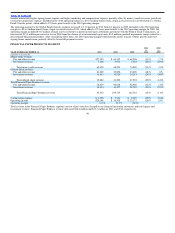
EARNINGS BEFORE INTEREST, TAXES, DEPRECIATION AND AMORTIZATION (“EBITDA”) AND ADJUSTED EBITDA
We believe that EBITDA (earnings before interest, taxes, depreciation and amortization, including agent signing bonus amortization) and Adjusted
EBITDA (EBITDA adjusted for significant items) provide useful information to investors because they are an indicator of the strength and performance of
ongoing business operations, including our ability to service debt and fund capital expenditures, acquisitions and operations. These calculations are
commonly used as a basis for investors, analysts and credit rating agencies to evaluate and compare the operating performance and value of companies
within our industry. In addition, our debt agreements require compliance with financial measures similar to Adjusted EBITDA. Finally, EBITDA and
Adjusted EBITDA are financial measures used by management in reviewing results of operations, forecasting, assessing cash flow and capital, allocating
resources and establishing employee incentive programs.
41