MoneyGram 2011 Annual Report Download - page 134
Download and view the complete annual report
Please find page 134 of the 2011 MoneyGram annual report below. You can navigate through the pages in the report by either clicking on the pages listed below, or by using the keyword search tool below to find specific information within the annual report.-
 1
1 -
2
-
3
-
4
-
5
-
6
-
7
-
8
-
9
-
10
-
11
-
12
-
13
-
14
-
15
-
16
-
17
-
18
-
19
-
20
-
21
-
22
-
23
-
24
-
25
-
26
-
27
-
28
-
29
-
30
-
31
-
32
-
33
-
34
-
35
-
36
-
37
-
38
-
39
-
40
-
41
-
42
-
43
-
44
-
45
-
46
-
47
-
48
-
49
-
50
-
51
-
52
-
53
-
54
-
55
-
56
-
57
-
58
-
59
-
60
-
61
-
62
-
63
-
64
-
65
-
66
-
67
-
68
-
69
-
70
-
71
-
72
-
73
-
74
-
75
-
76
-
77
-
78
-
79
-
80
-
81
-
82
-
83
-
84
-
85
-
86
-
87
-
88
-
89
-
90
-
91
-
92
-
93
-
94
-
95
-
96
-
97
-
98
-
99
-
100
-
101
-
102
-
103
-
104
-
105
-
106
-
107
-
108
-
109
-
110
-
111
-
112
-
113
-
114
-
115
-
116
-
117
-
118
-
119
-
120
-
121
-
122
-
123
-
 124
124 -
 125
125 -
 126
126 -
 127
127 -
 128
128 -
 129
129 -
 130
130 -
 131
131 -
 132
132 -
 133
133 -
 134
134 -
 135
135 -
 136
136 -
 137
137 -
 138
138 -
 139
139 -
 140
140 -
 141
141 -
 142
142 -
 143
143 -
 144
144 -
145
-
146
-
147
-
148
-
149
-
150
-
151
-
152
-
153
-
154
-
155
-
156
-
157
-
158
-
159
-
160
-
161
-
162
-
163
-
164
-
165
-
166
-
167
-
168
-
169
-
170
-
171
-
172
-
173
-
174
-
175
-
176
-
177
-
178
-
179
-
180
-
181
-
182
-
183
-
184
-
185
-
186
-
187
-
188
-
189
-
190
-
191
-
192
-
193
-
194
-
195
-
196
-
197
-
198
-
199
-
200
-
201
-
202
-
203
-
204
-
205
-
206
-
207
-
208
-
209
-
210
-
211
-
212
-
213
-
214
-
215
-
216
-
217
-
218
-
219
-
220
-
221
-
222
-
223
-
224
-
225
-
226
-
227
-
228
-
229
-
230
-
231
-
232
-
233
-
234
-
235
-
236
-
237
-
238
-
239
-
240
-
241
-
242
-
243
-
244
-
245
-
246
-
247
-
248
-
249
 |
 |
Table of Contents
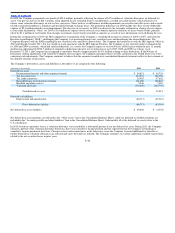
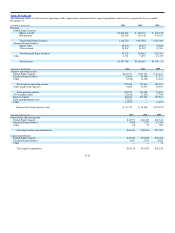
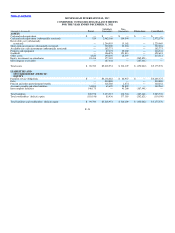
(Amounts in thousands) 2011 2010
Assets:
Global Funds Transfer $1,247,355 $1,017,574
Financial Paper Products 3,683,393 3,797,911
Other 244,830 300,251
Total assets $5,175,578 $5,115,736
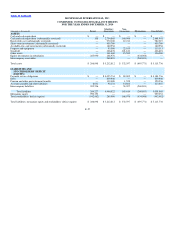
Geographic areas — International operations are located principally in Europe. International revenues are defined as revenues generated from money
transfer transactions originating in a country other than the United States. Long−lived assets are principally located in the United States. The table below
presents revenue by major geographic area for the year ended December 31:
(Amounts in thousands) 2011 2010 2009
United States $ 768,662 $ 762,276 $ 789,222
International 479,107 404,377 372,489
Total revenue $1,247,769 $1,166,653 $1,161,711
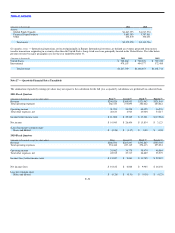
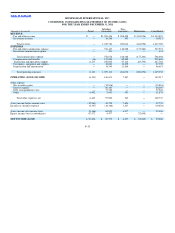
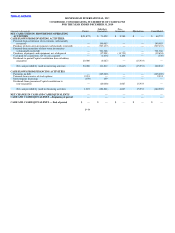
Note 17 — Quarterly Financial Data (Unaudited)
The summation of quarterly earnings per share may not equate to the calculation for the full year as quarterly calculations are performed on a discrete basis.
2011 Fiscal Quarters
(Amounts in thousands, except per share data) First (1) Second (1) Third (1) Fourth (1)
Revenue $294,024 $309,953 $321,947 $321,845
Total operating expenses 262,323 275,695 281,622 285,612
Operating income 31,701 34,258 40,325 36,233
Total other expenses, net 20,613 4,913 23,004 54,217
Income before income taxes $ 11,088 $ 29,345 $ 17,321 $(17,984)
Net income $ 14,045 $ 26,404 $ 15,834 $ 3,123
(Loss) Income per common share
Basic and diluted $ (0.26) $ (1.37) $ 0.03 $ 0.04
2010 Fiscal Quarters
(Amounts in thousands, except per share data) First Second (2) Third (2) Fourth (2)
Revenue $286,504 $283,897 $292,887 $303,365
Total operating expenses 251,442 247,119 254,413 255,281
Operating income 35,062 36,778 38,474 48,084
Total other expenses, net 22,015 27,717 24,689 25,597
Income (loss) before income taxes $ 13,047 $ 9,061 $ 13,785 $ 22,487
Net income (loss) $ 10,812 $ 6,848 $ 9,985 $ 16,156
Loss per common share
Basic and diluted $ (0.26) $ (0.31) $ (0.30) $ (0.23)
F−52