MoneyGram 2011 Annual Report Download - page 124
Download and view the complete annual report
Please find page 124 of the 2011 MoneyGram annual report below. You can navigate through the pages in the report by either clicking on the pages listed below, or by using the keyword search tool below to find specific information within the annual report.-
 1
1 -
2
-
3
-
4
-
5
-
6
-
7
-
8
-
9
-
10
-
11
-
12
-
13
-
14
-
15
-
16
-
17
-
18
-
19
-
20
-
21
-
22
-
23
-
24
-
25
-
26
-
27
-
28
-
29
-
30
-
31
-
32
-
33
-
34
-
35
-
36
-
37
-
38
-
39
-
40
-
41
-
42
-
43
-
44
-
45
-
46
-
47
-
48
-
49
-
50
-
51
-
52
-
53
-
54
-
55
-
56
-
57
-
58
-
59
-
60
-
61
-
62
-
63
-
64
-
65
-
66
-
67
-
68
-
69
-
70
-
71
-
72
-
73
-
74
-
75
-
76
-
77
-
78
-
79
-
80
-
81
-
82
-
83
-
84
-
85
-
86
-
87
-
88
-
89
-
90
-
91
-
92
-
93
-
94
-
95
-
96
-
97
-
98
-
99
-
100
-
101
-
102
-
103
-
104
-
105
-
106
-
107
-
108
-
109
-
110
-
111
-
112
-
113
-
 114
114 -
 115
115 -
 116
116 -
 117
117 -
 118
118 -
 119
119 -
 120
120 -
 121
121 -
 122
122 -
 123
123 -
 124
124 -
 125
125 -
 126
126 -
 127
127 -
 128
128 -
 129
129 -
 130
130 -
 131
131 -
 132
132 -
 133
133 -
 134
134 -
135
-
136
-
137
-
138
-
139
-
140
-
141
-
142
-
143
-
144
-
145
-
146
-
147
-
148
-
149
-
150
-
151
-
152
-
153
-
154
-
155
-
156
-
157
-
158
-
159
-
160
-
161
-
162
-
163
-
164
-
165
-
166
-
167
-
168
-
169
-
170
-
171
-
172
-
173
-
174
-
175
-
176
-
177
-
178
-
179
-
180
-
181
-
182
-
183
-
184
-
185
-
186
-
187
-
188
-
189
-
190
-
191
-
192
-
193
-
194
-
195
-
196
-
197
-
198
-
199
-
200
-
201
-
202
-
203
-
204
-
205
-
206
-
207
-
208
-
209
-
210
-
211
-
212
-
213
-
214
-
215
-
216
-
217
-
218
-
219
-
220
-
221
-
222
-
223
-
224
-
225
-
226
-
227
-
228
-
229
-
230
-
231
-
232
-
233
-
234
-
235
-
236
-
237
-
238
-
239
-
240
-
241
-
242
-
243
-
244
-
245
-
246
-
247
-
248
-
249
 |
 |

Table of Contents
“Performance−based Tranche”). The Time−based Tranche generally becomes exercisable over a five−year period in either (a) an equal number of shares
each year or (b) for some issuances in 2009, a tranched vesting schedule whereby 15 percent of the Time−based Tranche vests immediately and then at rates
of 10 to 20 percent each year. The Performance−based Tranche becomes exercisable upon the achievement within five years of grant of the earlier of (a) a
pre−defined common stock price for any period of 20 consecutive trading days, (b) a change in control of the Company resulting in a pre−defined per share
consideration or (c) in the event the Company’s common stock does not trade on a U.S. exchange or trading market, resulting in the Company’s common
stock meeting pre−defined equity values. All options granted in 2009, 2010 and 2011 have a term of 10 years. Beginning in the fourth quarter of 2011, all
options issued are time−based.
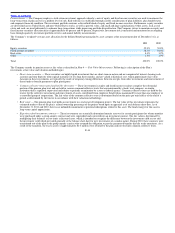
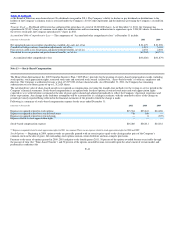
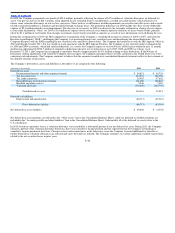
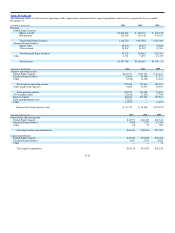
For purposes of determining the fair value of stock option awards, the Company uses the Black−Scholes single option pricing model for the Time−based
Tranches and awards and a combination of Monte−Carlo simulation and the Black−Scholes single option pricing model for the Performance−based
Tranches. The following table provides weighted−average grant−date fair value and assumptions utilized to estimate the grant−date fair value of the options
granted during the years ended December 31:
2011 2010 2009
Expected dividend yield (1) 0.0% 0.0% 0.0%
Expected volatility (2) 71.3%−72.9% 72.9%−74.8% 72.8%−76.9%
Risk−free interest rate (3) 1.3%−2.9% 1.8%−3.3% 2.3%−3.2%
Expected life (4) 6.3−6.5 years 5.3−6.5 years 5.3−6.5 years
Weighted−average grant−date fair value per option $16.23 $16.40 $11.92
(1) Expected dividend yield represents the level of dividends expected to be paid on the Company’s common stock over the expected term of the option. The Company does not anticipate
declaring any dividends at this time.
(2) Expected volatility is the amount by which the Company’s stock price has fluctuated or will fluctuate during the expected term of the option. The Company’s expected volatility is
calculated based on the historical volatility of the price of the Company’s common stock since the spin−off from Viad Corporation on June 30, 2004. The Company also considers any
known of anticipated factors which will likely impact future volatility.
(3) The risk−free rate for the Black−Scholes model is based on the United States Treasury yield curve in effect at the time of grant for periods within the expected term of the option, while
the risk−free rate for the Monte−Carlo simulation is based on the five−year United States Treasury yield in effect at the time of grant.
(4) Expected term represents the period of time that options are expected to be outstanding. The expected term was determined using the simplified method as the pattern of changes in the
value of the Company’s common stock and exercise activity since late 2007 has been inconsistent and substantially different from historical patterns. Additionally, there have been
minimal stock option exercises which would be representative of the Company’s normal exercise activity since 2007. Accordingly, the Company does not believe that historical terms are
relevant to the assessment of the expected term of the grant. Based on these factors, the Company does not believe that it has the ability to make a more refined estimate than the use of the
simplified method.
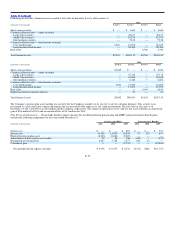
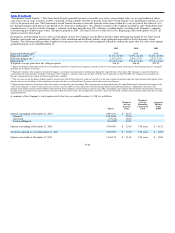
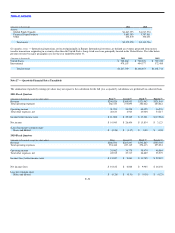
A summary of the Company’s stock option activity for the year ended December 31, 2011 is as follows:
Shares
Weighted−
Average
Exercise
Price
Weighted−
Average
Remaining
Contractual
Term
Aggregate
Intrinsic
Value
($000)
Options outstanding at December 31, 2010 4,987,301 $ 26.47
Granted 1,314,690 23.14
Exercised (35,314) 18.40
Forfeited/Expired (901,592) 39.91
Options outstanding at December 31, 2011 5,365,085 $ 23.45 7.98 years $ 4,121
Vested or expected to vest at December 31, 2011 5,183,595 $ 23.52 7.94 years $ 4,072
Options exercisable at December 31, 2011 1,164,178 $ 31.65 5.94 years $ 1,865
F−42