MoneyGram 2011 Annual Report Download - page 32
Download and view the complete annual report
Please find page 32 of the 2011 MoneyGram annual report below. You can navigate through the pages in the report by either clicking on the pages listed below, or by using the keyword search tool below to find specific information within the annual report.-
 1
1 -
2
-
3
-
4
-
5
-
6
-
7
-
8
-
9
-
10
-
11
-
12
-
13
-
14
-
15
-
16
-
17
-
18
-
19
-
20
-
21
-
 22
22 -
 23
23 -
 24
24 -
 25
25 -
 26
26 -
 27
27 -
 28
28 -
 29
29 -
 30
30 -
 31
31 -
 32
32 -
 33
33 -
 34
34 -
 35
35 -
 36
36 -
 37
37 -
 38
38 -
 39
39 -
 40
40 -
 41
41 -
 42
42 -
43
-
44
-
45
-
46
-
47
-
48
-
49
-
50
-
51
-
52
-
53
-
54
-
55
-
56
-
57
-
58
-
59
-
60
-
61
-
62
-
63
-
64
-
65
-
66
-
67
-
68
-
69
-
70
-
71
-
72
-
73
-
74
-
75
-
76
-
77
-
78
-
79
-
80
-
81
-
82
-
83
-
84
-
85
-
86
-
87
-
88
-
89
-
90
-
91
-
92
-
93
-
94
-
95
-
96
-
97
-
98
-
99
-
100
-
101
-
102
-
103
-
104
-
105
-
106
-
107
-
108
-
109
-
110
-
111
-
112
-
113
-
114
-
115
-
116
-
117
-
118
-
119
-
120
-
121
-
122
-
123
-
124
-
125
-
126
-
127
-
128
-
129
-
130
-
131
-
132
-
133
-
134
-
135
-
136
-
137
-
138
-
139
-
140
-
141
-
142
-
143
-
144
-
145
-
146
-
147
-
148
-
149
-
150
-
151
-
152
-
153
-
154
-
155
-
156
-
157
-
158
-
159
-
160
-
161
-
162
-
163
-
164
-
165
-
166
-
167
-
168
-
169
-
170
-
171
-
172
-
173
-
174
-
175
-
176
-
177
-
178
-
179
-
180
-
181
-
182
-
183
-
184
-
185
-
186
-
187
-
188
-
189
-
190
-
191
-
192
-
193
-
194
-
195
-
196
-
197
-
198
-
199
-
200
-
201
-
202
-
203
-
204
-
205
-
206
-
207
-
208
-
209
-
210
-
211
-
212
-
213
-
214
-
215
-
216
-
217
-
218
-
219
-
220
-
221
-
222
-
223
-
224
-
225
-
226
-
227
-
228
-
229
-
230
-
231
-
232
-
233
-
234
-
235
-
236
-
237
-
238
-
239
-
240
-
241
-
242
-
243
-
244
-
245
-
246
-
247
-
248
-
249
 |
 |
Table of Contents
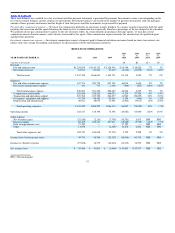
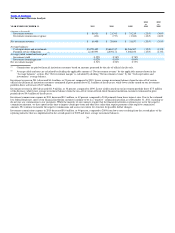
2010 includes a $16.4 million gain related to the reversal of a patent lawsuit; $1.8 million of legal accruals related primarily to shareholder litigation;
$1.8 million of asset impairments and $5.9 million of expense related to our global transformation initiative. Loss from continuing operations before
income taxes for 2009 includes $54.8 million of legal reserves relating to securities litigation, stockholder derivative claims, a patent lawsuit and a
settlement with the FTC; $18.3 million of goodwill and asset impairments and a $14.3 million net curtailment gain on our benefit plans. Loss from
continuing operations before income taxes for 2008 includes a $29.7 million net loss on the termination of swaps, a $26.5 million gain from put
options on our trading investments, a $16.0 million valuation loss from changes in the fair value of embedded derivatives on our Series B Stock and a
goodwill impairment of $8.8 million related to a discontinued business. Loss from continuing operations before income taxes for 2007 includes a
goodwill impairment of $6.4 million related to a discontinued business.
(3) Assets in excess of payment service obligations are substantially restricted assets less payment service obligations as calculated in Note 2 — Summary
of Significant Accounting Policies of the Notes to Consolidated Financial Statements. Substantially restricted assets are composed of cash and cash
equivalents, receivables and investments.
(4) Mezzanine Equity related to our Series B Stock. Following the 2011 Recapitalization, all amounts included in mezzanine equity were converted into
components of stockholders’ deficit and no shares of Series B Stock remained issued at December 31, 2011. See Note 11 — Mezzanine Equity of the
Notes to Consolidated Financial Statements for the terms of the Series B Stock.
(5) Investable balances are composed of cash and cash equivalents and all classes of investments.
(6) Net investment margin is determined as net investment revenue (investment revenue less investment commissions) divided by daily average
investable balances.
(7) Includes 29,000, 27,000, 28,000, 30,000 and 18,000 locations in 2011, 2010, 2009, 2008 and 2007, respectively, which offer both money order and
money transfer services.
Item 7. MANAGEMENT’S DISCUSSION AND ANALYSIS OF FINANCIAL CONDITION AND RESULTS OF OPERATIONS
The following discussion should be read in conjunction with our Consolidated Financial Statements and related Notes. This discussion contains
forward−looking statements that involve risks and uncertainties. MoneyGram’s actual results could differ materially from those anticipated due to various
factors discussed below under “Cautionary Statements Regarding Forward−Looking Statements” and under the caption “Risk Factors” in Part 1, Item 1A of
this Annual Report on Form 10−K.
Basis of Presentation
The financial statements in this Annual Report on Form 10−K are presented on a consolidated basis and include the accounts of the Company and our
subsidiaries. See Note 2 — Summary of Significant Accounting Policies of the Notes to the Consolidated Financial Statements for further information
regarding consolidation. References to “MoneyGram,” the “Company,” “we,” “us” and “our” are to MoneyGram International, Inc. and its subsidiaries and
consolidated entities. Our Consolidated Financial Statements are prepared in conformity with accounting principles generally accepted in the United States
of America, also referred to as GAAP.
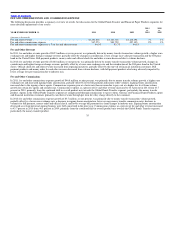
Fee and other revenue — Fee and other revenue consists of transaction fees, foreign exchange revenue and miscellaneous revenue. Transaction fees are
earned on money transfer, money order, bill payment and official check transactions. Money transfer transaction fees vary based on the principal amount of
the transaction, the originating location and the receiving location. Money order, bill payment and official check transaction fees are fixed per transaction.
Foreign exchange revenue is derived from the management of currency exchange spreads on money transfer transactions involving different “send” and
“receive” currencies. Miscellaneous revenue primarily consists of processing fees on rebate checks and controlled disbursements, service charges on aged
outstanding money orders and money order dispenser fees.
Investment revenue — Investment revenue consists of interest and dividends generated through the investment of cash balances received primarily from the
sale of official checks, money orders and other payment instruments.
31