MoneyGram 2011 Annual Report Download - page 67
Download and view the complete annual report
Please find page 67 of the 2011 MoneyGram annual report below. You can navigate through the pages in the report by either clicking on the pages listed below, or by using the keyword search tool below to find specific information within the annual report.-
 1
1 -
2
-
3
-
4
-
5
-
6
-
7
-
8
-
9
-
10
-
11
-
12
-
13
-
14
-
15
-
16
-
17
-
18
-
19
-
20
-
21
-
22
-
23
-
24
-
25
-
26
-
27
-
28
-
29
-
30
-
31
-
32
-
33
-
34
-
35
-
36
-
37
-
38
-
39
-
40
-
41
-
42
-
43
-
44
-
45
-
46
-
47
-
48
-
49
-
50
-
51
-
52
-
53
-
54
-
55
-
56
-
 57
57 -
 58
58 -
 59
59 -
 60
60 -
 61
61 -
 62
62 -
 63
63 -
 64
64 -
 65
65 -
 66
66 -
 67
67 -
 68
68 -
 69
69 -
 70
70 -
 71
71 -
 72
72 -
 73
73 -
 74
74 -
 75
75 -
 76
76 -
 77
77 -
78
-
79
-
80
-
81
-
82
-
83
-
84
-
85
-
86
-
87
-
88
-
89
-
90
-
91
-
92
-
93
-
94
-
95
-
96
-
97
-
98
-
99
-
100
-
101
-
102
-
103
-
104
-
105
-
106
-
107
-
108
-
109
-
110
-
111
-
112
-
113
-
114
-
115
-
116
-
117
-
118
-
119
-
120
-
121
-
122
-
123
-
124
-
125
-
126
-
127
-
128
-
129
-
130
-
131
-
132
-
133
-
134
-
135
-
136
-
137
-
138
-
139
-
140
-
141
-
142
-
143
-
144
-
145
-
146
-
147
-
148
-
149
-
150
-
151
-
152
-
153
-
154
-
155
-
156
-
157
-
158
-
159
-
160
-
161
-
162
-
163
-
164
-
165
-
166
-
167
-
168
-
169
-
170
-
171
-
172
-
173
-
174
-
175
-
176
-
177
-
178
-
179
-
180
-
181
-
182
-
183
-
184
-
185
-
186
-
187
-
188
-
189
-
190
-
191
-
192
-
193
-
194
-
195
-
196
-
197
-
198
-
199
-
200
-
201
-
202
-
203
-
204
-
205
-
206
-
207
-
208
-
209
-
210
-
211
-
212
-
213
-
214
-
215
-
216
-
217
-
218
-
219
-
220
-
221
-
222
-
223
-
224
-
225
-
226
-
227
-
228
-
229
-
230
-
231
-
232
-
233
-
234
-
235
-
236
-
237
-
238
-
239
-
240
-
241
-
242
-
243
-
244
-
245
-
246
-
247
-
248
-
249
 |
 |

Table of Contents
Description Judgments and Uncertainties Effect if Actual Results Differ From
Assumptions
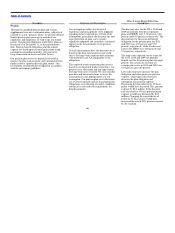
Pension
Through our qualified pension plan and various
supplemental executive retirement plans, collectively
referred to as our “pension” plans, we provide defined
benefit pension plan coverage to certain of our
employees and employees of Viad Corp, our former
parent. Our pension obligations under these plans are
measured as of December 31, or the measurement
date. Pension benefit obligations and the related
expense are based upon actuarial projections using
assumptions regarding mortality, discount rates,
long−term return on assets and other factors.
Our pension plan assets are primarily invested in
interest−bearing cash accounts and commingled trust
funds issued or sponsored by the plan trustee. Our
investments are periodically realigned in accordance
with the investment guidelines.
Our assumptions reflect our historical
experience and management’s best judgment
regarding future expectations. Certain of the
assumptions, particularly the discount rate and
expected return on plan assets, require
significant judgment and could have a material
impact on the measurement of our pension
obligation.
At each measurement date, the discount rate is
based on the then current interest rate yield
curves for long−term corporate debt securities
with maturities rate AA comparable to our
obligations.
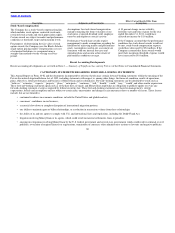
The expected return on pension plan assets is
based on our historical market experience, our
pension asset allocations and our expectations
for long−term rates of return. We also consider
peer data and historical returns to assess the
reasonableness and appropriateness of our
assumption. Our pension plan asset allocations
are reviewed annually and are based upon plan
obligations, an evaluation of market conditions,
tolerance for risk and cash requirements for
benefit payments.
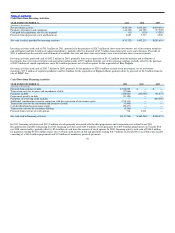
The discount rates for the 2011, 2010 and
2009 net periodic benefit cost pension
plans and SERPs were 5.30 percent, 5.80
percent and 6.30 percent, respectively. The
discount rate for the projected benefit
obligation for the pension plan for 2011
and 2010 was 4.90 percent and 5.30
percent, respectively, while the discount
rate for the SERPs was 4.80 percent and
5.30 percent, respectively.
The long−term expected rate of return for
the 2011, 2010 and 2009 net periodic
benefit cost for the pension plan was eight
percent. The actual rate of return on
average plan assets in 2011 and 2010 was
4.14 percent and 4.80 percent.
Lower discount rates increase the plan
obligation and subsequent year pension
expense, while higher discount rates
decrease the plan obligation and
subsequent year pension expense.
Decreasing the discount rate by 50 basis
points would have increased 2011 pension
expense by $0.4 million. If the discount
rate increased by 50 basis points pension
expense would have decreased by $0.3
million. Changing the expected rate of
return by 50 basis points would have
increased/decreased 2011 pension expense
by $0.5 million.
66