MoneyGram 2011 Annual Report Download - page 38
Download and view the complete annual report
Please find page 38 of the 2011 MoneyGram annual report below. You can navigate through the pages in the report by either clicking on the pages listed below, or by using the keyword search tool below to find specific information within the annual report.-
 1
1 -
2
-
3
-
4
-
5
-
6
-
7
-
8
-
9
-
10
-
11
-
12
-
13
-
14
-
15
-
16
-
17
-
18
-
19
-
20
-
21
-
22
-
23
-
24
-
25
-
26
-
27
-
 28
28 -
 29
29 -
 30
30 -
 31
31 -
 32
32 -
 33
33 -
 34
34 -
 35
35 -
 36
36 -
 37
37 -
 38
38 -
 39
39 -
 40
40 -
 41
41 -
 42
42 -
 43
43 -
 44
44 -
 45
45 -
 46
46 -
 47
47 -
 48
48 -
49
-
50
-
51
-
52
-
53
-
54
-
55
-
56
-
57
-
58
-
59
-
60
-
61
-
62
-
63
-
64
-
65
-
66
-
67
-
68
-
69
-
70
-
71
-
72
-
73
-
74
-
75
-
76
-
77
-
78
-
79
-
80
-
81
-
82
-
83
-
84
-
85
-
86
-
87
-
88
-
89
-
90
-
91
-
92
-
93
-
94
-
95
-
96
-
97
-
98
-
99
-
100
-
101
-
102
-
103
-
104
-
105
-
106
-
107
-
108
-
109
-
110
-
111
-
112
-
113
-
114
-
115
-
116
-
117
-
118
-
119
-
120
-
121
-
122
-
123
-
124
-
125
-
126
-
127
-
128
-
129
-
130
-
131
-
132
-
133
-
134
-
135
-
136
-
137
-
138
-
139
-
140
-
141
-
142
-
143
-
144
-
145
-
146
-
147
-
148
-
149
-
150
-
151
-
152
-
153
-
154
-
155
-
156
-
157
-
158
-
159
-
160
-
161
-
162
-
163
-
164
-
165
-
166
-
167
-
168
-
169
-
170
-
171
-
172
-
173
-
174
-
175
-
176
-
177
-
178
-
179
-
180
-
181
-
182
-
183
-
184
-
185
-
186
-
187
-
188
-
189
-
190
-
191
-
192
-
193
-
194
-
195
-
196
-
197
-
198
-
199
-
200
-
201
-
202
-
203
-
204
-
205
-
206
-
207
-
208
-
209
-
210
-
211
-
212
-
213
-
214
-
215
-
216
-
217
-
218
-
219
-
220
-
221
-
222
-
223
-
224
-
225
-
226
-
227
-
228
-
229
-
230
-
231
-
232
-
233
-
234
-
235
-
236
-
237
-
238
-
239
-
240
-
241
-
242
-
243
-
244
-
245
-
246
-
247
-
248
-
249
 |
 |

Table of Contents
OPERATING EXPENSES
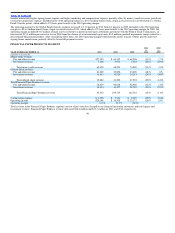
The following discussion relates to operating expenses, excluding commissions expense.
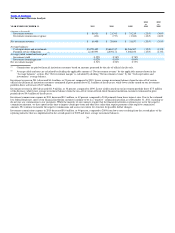
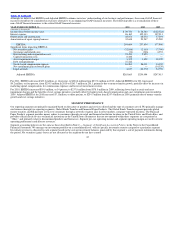
Compensation and benefits — Compensation and benefits includes salaries and benefits, management incentive programs, related payroll taxes and other
employee related costs. Following is a summary of the change in compensation and benefits:
YEAR ENDED DECEMBER 31, 2011 2010
(Amounts in thousands)
Compensation and benefits expense for the prior year $226,422 $199,053
Change from:
Incentive compensation 8,084 1,636
Salaries and related payroll taxes 6,458 3,561
Restructuring and reorganization 3,603 2,970
Impact of change in Euro currency 2,542 (2,826)
Employee stock−based compensation (9,994) 11,470
Other employee benefits (1,419) 10,558
Compensation and benefits expense for the years ended December 31, $235,696 $226,422
In 2011, incentive compensation increased primarily from stronger performance against current year objectives. Salaries and related payroll taxes increased
from ordinary salary increases and our changing employee base mix as we invest in our sales, market development and compliance functions, partially
offset by lower headcount from our restructuring and outsourcing initiatives. Restructuring and reorganization costs increased primarily due to employee
severance costs associated with the centralization and relocation of certain functions. Employee stock−based compensation decreased from grants fully
vesting in prior periods and forfeitures, partially offset by new grants. Other employee benefits decreased due to medical claim reimbursements in 2011 and
non−restructuring severance costs in 2010. We incurred higher expense associated with our legacy defined benefit plans from the impact of lower interest
rates on our obligations under those plans, net of a reduction in the number of eligible participants and reduced benefits in the legacy post−retirement
medical plan.
In 2010, incentive compensation increased from higher participation levels that increased the compensation base as compared to the prior year, partially
offset by lower sales incentives accruals. Salaries and related payroll taxes increased from ordinary salary increases. Restructuring and reorganization costs
increased primarily due to employee severance costs associated with the centralization and relocation of certain functions. Stock−based compensation
increased from grants made in 2010 and the second half of 2009 in connection with executive hires. Other employee benefits in 2009 included a
$14.3 million net curtailment gain on benefit plans, partially offset by $3.9 million of executive severance costs.
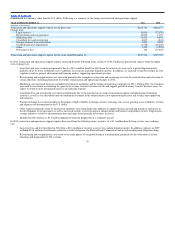
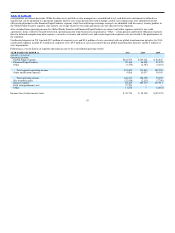
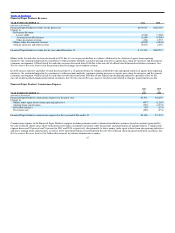
Transaction and operations support — Transaction and operations support expense primarily includes: marketing; professional fees and other outside
services; telecommunications; agent support costs, including forms related to our products; non−compensation employee costs, including training, travel
and relocation; bank charges; and the impact of foreign exchange rate movements on our monetary transactions, assets and liabilities
37