MoneyGram 2011 Annual Report Download - page 116
Download and view the complete annual report
Please find page 116 of the 2011 MoneyGram annual report below. You can navigate through the pages in the report by either clicking on the pages listed below, or by using the keyword search tool below to find specific information within the annual report.-
 1
1 -
2
-
3
-
4
-
5
-
6
-
7
-
8
-
9
-
10
-
11
-
12
-
13
-
14
-
15
-
16
-
17
-
18
-
19
-
20
-
21
-
22
-
23
-
24
-
25
-
26
-
27
-
28
-
29
-
30
-
31
-
32
-
33
-
34
-
35
-
36
-
37
-
38
-
39
-
40
-
41
-
42
-
43
-
44
-
45
-
46
-
47
-
48
-
49
-
50
-
51
-
52
-
53
-
54
-
55
-
56
-
57
-
58
-
59
-
60
-
61
-
62
-
63
-
64
-
65
-
66
-
67
-
68
-
69
-
70
-
71
-
72
-
73
-
74
-
75
-
76
-
77
-
78
-
79
-
80
-
81
-
82
-
83
-
84
-
85
-
86
-
87
-
88
-
89
-
90
-
91
-
92
-
93
-
94
-
95
-
96
-
97
-
98
-
99
-
100
-
101
-
102
-
103
-
104
-
105
-
 106
106 -
 107
107 -
 108
108 -
 109
109 -
 110
110 -
 111
111 -
 112
112 -
 113
113 -
 114
114 -
 115
115 -
 116
116 -
 117
117 -
 118
118 -
 119
119 -
 120
120 -
 121
121 -
 122
122 -
 123
123 -
 124
124 -
 125
125 -
 126
126 -
127
-
128
-
129
-
130
-
131
-
132
-
133
-
134
-
135
-
136
-
137
-
138
-
139
-
140
-
141
-
142
-
143
-
144
-
145
-
146
-
147
-
148
-
149
-
150
-
151
-
152
-
153
-
154
-
155
-
156
-
157
-
158
-
159
-
160
-
161
-
162
-
163
-
164
-
165
-
166
-
167
-
168
-
169
-
170
-
171
-
172
-
173
-
174
-
175
-
176
-
177
-
178
-
179
-
180
-
181
-
182
-
183
-
184
-
185
-
186
-
187
-
188
-
189
-
190
-
191
-
192
-
193
-
194
-
195
-
196
-
197
-
198
-
199
-
200
-
201
-
202
-
203
-
204
-
205
-
206
-
207
-
208
-
209
-
210
-
211
-
212
-
213
-
214
-
215
-
216
-
217
-
218
-
219
-
220
-
221
-
222
-
223
-
224
-
225
-
226
-
227
-
228
-
229
-
230
-
231
-
232
-
233
-
234
-
235
-
236
-
237
-
238
-
239
-
240
-
241
-
242
-
243
-
244
-
245
-
246
-
247
-
248
-
249
 |
 |

Table of Contents
Pension Assets — The Company employs a total return investment approach whereby a mix of equity and fixed income securities are used to maximize the
long−term return of plan assets for a prudent level of risk. Risk tolerance is established through careful consideration of plan liabilities, plan funded status
and corporate financial condition. The investment portfolio contains a diversified blend of equity and fixed income securities. Furthermore, equity securities
are diversified across United States and non−United States stocks, as well as growth, value, and small and large capitalizations. Other assets, such as real
estate and cash, are used judiciously to enhance long−term returns while improving portfolio diversification. The Company strives to maintain an equity and
fixed income securities allocation mix of approximately 60 percent and 40 percent, respectively. Investment risk is measured and monitored on an ongoing
basis through quarterly investment portfolio reviews and annual liability measurements.
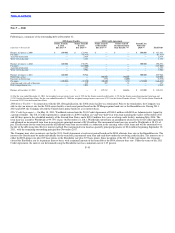
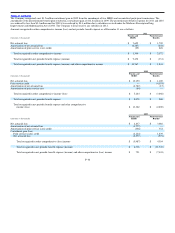
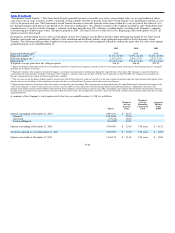
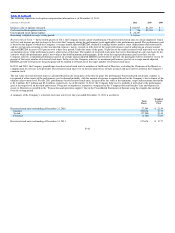
The Company’s weighted−average asset allocation for the defined benefit pension plan by asset category at the measurement date of December 31 is as
follows:
2011 2010
Equity securities 55.9% 59.8%
Fixed income securities 38.3% 34.4%
Real estate 4.3% 3.9%
Other 1.5% 1.9%
Total 100.0% 100.0%
The Company records its pension assets at fair value as described in Note 4 — Fair Value Measurement. Following is a description of the Plan’s
investments at fair value and valuation methodologies:
•Short−term securities — These securities are highly liquid investments that are short−term in nature and are comprised of interest−bearing cash
accounts and time deposits with original maturities of less than three months, and are valued at historical cost, which approximates fair value.
Amounts in these investments are typically the result of temporary timing differences between receipts from other investments and reinvestment of
those funds or benefit payments to plan participants.
•Common collective trusts issued and held by the trustee — These investments in equity and fixed income securities comprise the substantial
portion of the pension plan trust and are held in various common/collective trusts that are maintained by a bank, trust company, or similar
institution that is regulated, supervised and subject to periodic examination by a state or federal agency. Common collective trusts are held by the
trustee for the collective investment and reinvestment of assets contributed from employee benefit plans maintained by more than one employer or
a controlled group of corporations. The fair value of the common collective trust is determined based on the price per unit held as of the end of a
period as determined by the trustee in accordance with their valuation methodology.
•Real estate — The pension plan trust holds an investment in a real estate development project. The fair value of this investment represents the
estimated market value of the plan’s related ownership percentage of the project based upon an appraisal as of each balance sheet date. As of
December 31, 2011 and 2010, there is no unfunded commitment or potential redemptions related to this asset. The fund strategy for this asset is
long−term capital appreciation.
•Experience fund investment contracts — These investments are actuarially determined annuity reserves for certain participants for whom annuities
were purchased under a group annuity contract and were superseded and converted into an investment contract. The fair value is determined by
multiplying their balances at cost times a discount factor, which is intended to recognize the difference between the investment yield at cost and
the investment yield which prevailed generally at the balance sheet date for new investments of a similar nature. During 2010, these contracts were
transitioned out of the plan to the group annuity carriers who assumed the obligation to pay the guaranteed benefits directly to the annuitants. As a
result of the transition, the excess assets of approximately $1.0 million were returned to the plan and invested into common collective trusts.
F−34