MoneyGram 2011 Annual Report Download - page 62
Download and view the complete annual report
Please find page 62 of the 2011 MoneyGram annual report below. You can navigate through the pages in the report by either clicking on the pages listed below, or by using the keyword search tool below to find specific information within the annual report.-
 1
1 -
2
-
3
-
4
-
5
-
6
-
7
-
8
-
9
-
10
-
11
-
12
-
13
-
14
-
15
-
16
-
17
-
18
-
19
-
20
-
21
-
22
-
23
-
24
-
25
-
26
-
27
-
28
-
29
-
30
-
31
-
32
-
33
-
34
-
35
-
36
-
37
-
38
-
39
-
40
-
41
-
42
-
43
-
44
-
45
-
46
-
47
-
48
-
49
-
50
-
51
-
 52
52 -
 53
53 -
 54
54 -
 55
55 -
 56
56 -
 57
57 -
 58
58 -
 59
59 -
 60
60 -
 61
61 -
 62
62 -
 63
63 -
 64
64 -
 65
65 -
 66
66 -
 67
67 -
 68
68 -
 69
69 -
 70
70 -
 71
71 -
 72
72 -
73
-
74
-
75
-
76
-
77
-
78
-
79
-
80
-
81
-
82
-
83
-
84
-
85
-
86
-
87
-
88
-
89
-
90
-
91
-
92
-
93
-
94
-
95
-
96
-
97
-
98
-
99
-
100
-
101
-
102
-
103
-
104
-
105
-
106
-
107
-
108
-
109
-
110
-
111
-
112
-
113
-
114
-
115
-
116
-
117
-
118
-
119
-
120
-
121
-
122
-
123
-
124
-
125
-
126
-
127
-
128
-
129
-
130
-
131
-
132
-
133
-
134
-
135
-
136
-
137
-
138
-
139
-
140
-
141
-
142
-
143
-
144
-
145
-
146
-
147
-
148
-
149
-
150
-
151
-
152
-
153
-
154
-
155
-
156
-
157
-
158
-
159
-
160
-
161
-
162
-
163
-
164
-
165
-
166
-
167
-
168
-
169
-
170
-
171
-
172
-
173
-
174
-
175
-
176
-
177
-
178
-
179
-
180
-
181
-
182
-
183
-
184
-
185
-
186
-
187
-
188
-
189
-
190
-
191
-
192
-
193
-
194
-
195
-
196
-
197
-
198
-
199
-
200
-
201
-
202
-
203
-
204
-
205
-
206
-
207
-
208
-
209
-
210
-
211
-
212
-
213
-
214
-
215
-
216
-
217
-
218
-
219
-
220
-
221
-
222
-
223
-
224
-
225
-
226
-
227
-
228
-
229
-
230
-
231
-
232
-
233
-
234
-
235
-
236
-
237
-
238
-
239
-
240
-
241
-
242
-
243
-
244
-
245
-
246
-
247
-
248
-
249
 |
 |

Table of Contents
accounts, deposit accounts, time deposits and certificates of deposit, and U.S. government money market funds. These types of investments have minimal
risk of declines in fair value from changes in interest rates. Our commissions paid to financial institution customers are variable rate, which was zero in
2011, based primarily on the federal funds effective rate and are reset daily. Accordingly, both our investment revenue and our investment commissions
expense will decrease when rates decline and increase when rates rise.
In the second quarter of 2008, we repriced our official check product to an average below the federal funds rate to better match our investment commission
rate with our lower yield realigned portfolio. In the current environment, the federal funds effective rate is so low that most of our financial institution
customers are in a “negative” commission position, in that we do not owe any commissions to our customers.
Our 2011 Credit Agreement is variable rate resulting in decreases to interest expense in a declining rate environment and increases to interest expense when
rates rise. The Company may elect an interest rate for the senior credit facility at each reset period based on the BOA prime bank rate or the Eurodollar rate.
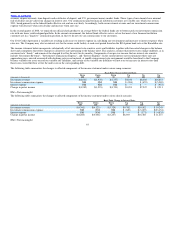
The income statement below incorporates substantially all of our interest rate sensitive assets and liabilities together with forecasted changes in the balance
sheet and assumptions that reflect changes in all interest rates pertaining to the balance sheet. This analysis assumes that interest rates change suddenly, as in
an interest rate “shock,” and remain at the changed level for the next twelve months. Components of our pre−tax income that are interest rate sensitive
include “Investment Revenue”, “Investment Commissions Expense”, and “Interest Expense”. In the current interest rate environment where rates are
approaching zero, our risk associated with declining rates is not material. A rapidly rising interest rate environment would be beneficial to the Company
because variable rate assets exceed our variable rate liabilities, and certain of our variable rate liabilities will not react to increases in interest rates until
those rates exceed the floor set for the index rate on the corresponding debt.
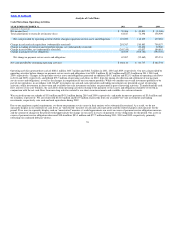
The following table summarizes the changes to affected components of the income statement under various ramp scenarios:
Basis Point Change in Interest Rates
Down Down Down Up Up Up
(Amounts in thousands) 200 100 50 50 100 200
Investment revenue $(2,041) $(1,978) $(1,757) $4,194 $8,402 $16,853
Investment commissions expense NM NM NM $ (204) $ (455) $ (5,989)
Interest expense NM NM NM $ — $ — $ (953)
Change in pretax income $(1,985) $(1,923) $(1,701) $3,991 $7,947 $ 9,911
NM = Not meaningful
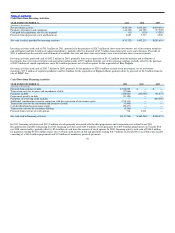
The following table summarizes the changes to affected components of the income statement under various shock scenarios:
Basis Point Change in Interest Rates
Down Down Down Up Up Up
(Amounts in thousands) 200 100 50 50 100 200
Investment revenue $(4,341) $(4,125) $(3,324) $9,762 $19,582 $ 39,243
Investment commissions expense NM NM NM $ (869) $ (3,025) $(23,154)
Interest expense NM NM NM $ — $ (171) $ (4,833)
Change in pretax income $(4,264) $(4,048) $(3,247) $8,893 $16,386 $ 11,257
NM = Not meaningful
61