MoneyGram 2011 Annual Report Download - page 7
Download and view the complete annual report
Please find page 7 of the 2011 MoneyGram annual report below. You can navigate through the pages in the report by either clicking on the pages listed below, or by using the keyword search tool below to find specific information within the annual report.-
 1
1 -
 2
2 -
 3
3 -
 4
4 -
 5
5 -
 6
6 -
 7
7 -
 8
8 -
 9
9 -
 10
10 -
 11
11 -
 12
12 -
 13
13 -
 14
14 -
 15
15 -
 16
16 -
 17
17 -
 18
18 -
19
-
20
-
21
-
22
-
23
-
24
-
25
-
26
-
27
-
28
-
29
-
30
-
31
-
32
-
33
-
34
-
35
-
36
-
37
-
38
-
39
-
40
-
41
-
42
-
43
-
44
-
45
-
46
-
47
-
48
-
49
-
50
-
51
-
52
-
53
-
54
-
55
-
56
-
57
-
58
-
59
-
60
-
61
-
62
-
63
-
64
-
65
-
66
-
67
-
68
-
69
-
70
-
71
-
72
-
73
-
74
-
75
-
76
-
77
-
78
-
79
-
80
-
81
-
82
-
83
-
84
-
85
-
86
-
87
-
88
-
89
-
90
-
91
-
92
-
93
-
94
-
95
-
96
-
97
-
98
-
99
-
100
-
101
-
102
-
103
-
104
-
105
-
106
-
107
-
108
-
109
-
110
-
111
-
112
-
113
-
114
-
115
-
116
-
117
-
118
-
119
-
120
-
121
-
122
-
123
-
124
-
125
-
126
-
127
-
128
-
129
-
130
-
131
-
132
-
133
-
134
-
135
-
136
-
137
-
138
-
139
-
140
-
141
-
142
-
143
-
144
-
145
-
146
-
147
-
148
-
149
-
150
-
151
-
152
-
153
-
154
-
155
-
156
-
157
-
158
-
159
-
160
-
161
-
162
-
163
-
164
-
165
-
166
-
167
-
168
-
169
-
170
-
171
-
172
-
173
-
174
-
175
-
176
-
177
-
178
-
179
-
180
-
181
-
182
-
183
-
184
-
185
-
186
-
187
-
188
-
189
-
190
-
191
-
192
-
193
-
194
-
195
-
196
-
197
-
198
-
199
-
200
-
201
-
202
-
203
-
204
-
205
-
206
-
207
-
208
-
209
-
210
-
211
-
212
-
213
-
214
-
215
-
216
-
217
-
218
-
219
-
220
-
221
-
222
-
223
-
224
-
225
-
226
-
227
-
228
-
229
-
230
-
231
-
232
-
233
-
234
-
235
-
236
-
237
-
238
-
239
-
240
-
241
-
242
-
243
-
244
-
245
-
246
-
247
-
248
-
249
 |
 |
Table of Contents
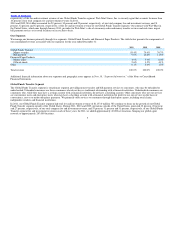
Following is a summary of our agent locations by geography:
YEAR ENDED DECEMBER 31, 2011
Latin America 18,000
Mexico 14,000
North America 41,000
Western Europe 46,000
Eastern Europe 46,000
Indian subcontinent 45,000
Asia Pacific 35,000
Africa 18,000
Middle East 4,000
Total Agent Locations 267,000
We provide Global Funds Transfer products and services utilizing a variety of proprietary point−of−sale platforms. Our platforms include AgentConnect ®,
which is integrated into an agent’s point−of−sale system, and DeltaWorks® and Delta T3®, which are separate software and stand−alone device platforms.
Through our FormFree® service, customers may contact our call center and a representative will collect transaction information over the telephone, entering
it directly into our central data processing system. We also operate two customer care centers in the United States, and we contract for additional call center
services in various countries. We provide call center services 24 hours per day, 365 days per year and provide customer service in approximately
30 languages.
Money Transfers — We derive our money transfer revenues primarily from consumer transaction fees and the management of currency exchange spreads on
money transfer transactions involving different “send” and “receive” currencies. We have corridor pricing capabilities that enable us to establish different
consumer fees and foreign exchange rates for our money transfer services by location, for a broader segment such as defined ZIP code regions or for a
widespread direct marketing area.
As of December 31, 2011, we offer money transfers to consumers in a choice of local currency or United States dollars and/or euros in 141 countries, which
we refer to as multi−currency. Our multi−currency technology allows us to execute our money transfers directly between and among several different
currencies. Where implemented, these capabilities allow consumers to know the amount that will be received in the local currency of the receiving country,
or in U.S. dollars or euros in certain countries.
Bill Payment Services — We derive our bill payment revenues primarily from transaction fees charged to consumers for each bill payment transaction
completed. Through our bill payment services, consumers can make urgent payments or pay routine bills through our network to certain billers. We
maintain relationships with billers in key industries, also referred to as verticals. These industries include the credit card, mortgage, auto finance,
telecommunications, corrections, satellite, property management, prepaid card and collections industries. Our bill payment services also enable consumers
to load and reload prepaid debit cards. Our bill payment services also allow customers to make low−cost, in−person payments of non−urgent utility bills for
credit to a biller, typically within two to three days.
Financial Paper Products Segment
Our Financial Paper Products segment provides money orders to consumers through our retail and financial institution agent locations in the United States
and Puerto Rico, and provides official check services for financial institutions in the United States.
In 2011, our Financial Paper Products segment generated revenues of $93.3 million. Since early 2008, our investment portfolio has consisted of lower risk,
highly liquid, short−term U.S. government securities that produce a lower rate of return, which has resulted in lower revenues and profit margins in our
Financial Paper Products segment.
6