MoneyGram 2011 Annual Report Download - page 46
Download and view the complete annual report
Please find page 46 of the 2011 MoneyGram annual report below. You can navigate through the pages in the report by either clicking on the pages listed below, or by using the keyword search tool below to find specific information within the annual report.-
 1
1 -
2
-
3
-
4
-
5
-
6
-
7
-
8
-
9
-
10
-
11
-
12
-
13
-
14
-
15
-
16
-
17
-
18
-
19
-
20
-
21
-
22
-
23
-
24
-
25
-
26
-
27
-
28
-
29
-
30
-
31
-
32
-
33
-
34
-
35
-
 36
36 -
 37
37 -
 38
38 -
 39
39 -
 40
40 -
 41
41 -
 42
42 -
 43
43 -
 44
44 -
 45
45 -
 46
46 -
 47
47 -
 48
48 -
 49
49 -
 50
50 -
 51
51 -
 52
52 -
 53
53 -
 54
54 -
 55
55 -
 56
56 -
57
-
58
-
59
-
60
-
61
-
62
-
63
-
64
-
65
-
66
-
67
-
68
-
69
-
70
-
71
-
72
-
73
-
74
-
75
-
76
-
77
-
78
-
79
-
80
-
81
-
82
-
83
-
84
-
85
-
86
-
87
-
88
-
89
-
90
-
91
-
92
-
93
-
94
-
95
-
96
-
97
-
98
-
99
-
100
-
101
-
102
-
103
-
104
-
105
-
106
-
107
-
108
-
109
-
110
-
111
-
112
-
113
-
114
-
115
-
116
-
117
-
118
-
119
-
120
-
121
-
122
-
123
-
124
-
125
-
126
-
127
-
128
-
129
-
130
-
131
-
132
-
133
-
134
-
135
-
136
-
137
-
138
-
139
-
140
-
141
-
142
-
143
-
144
-
145
-
146
-
147
-
148
-
149
-
150
-
151
-
152
-
153
-
154
-
155
-
156
-
157
-
158
-
159
-
160
-
161
-
162
-
163
-
164
-
165
-
166
-
167
-
168
-
169
-
170
-
171
-
172
-
173
-
174
-
175
-
176
-
177
-
178
-
179
-
180
-
181
-
182
-
183
-
184
-
185
-
186
-
187
-
188
-
189
-
190
-
191
-
192
-
193
-
194
-
195
-
196
-
197
-
198
-
199
-
200
-
201
-
202
-
203
-
204
-
205
-
206
-
207
-
208
-
209
-
210
-
211
-
212
-
213
-
214
-
215
-
216
-
217
-
218
-
219
-
220
-
221
-
222
-
223
-
224
-
225
-
226
-
227
-
228
-
229
-
230
-
231
-
232
-
233
-
234
-
235
-
236
-
237
-
238
-
239
-
240
-
241
-
242
-
243
-
244
-
245
-
246
-
247
-
248
-
249
 |
 |

Table of Contents
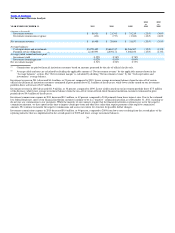
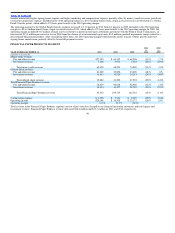
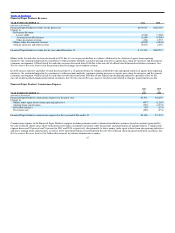
Money Transfer Transactions and Agent Locations
2011 2010
vs. vs.
YEAR ENDED DECEMBER 31, 2010 2009
Total transactions 14% 9%
Transactions originating outside of the United States 15% 15%
Transactions originating in the United States 13% 6%
Transactions originating in the United States excluding those sent to Mexico 13% 8%
Transactions and the related fee revenue are viewed as originating from the send side of a transaction. Accordingly, discussion of transactions by geographic
location refers to the region originating a transaction. Money transfer transactions originating in the United States, excluding transactions sent to Mexico,
increased due primarily to an increase in intra−United States remittances. Transactions sent to Mexico grew by 12 percent. Mexico represented
approximately nine percent of our total transactions in 2011 and 2010.
Our money transfer agent base expanded 18 percent, 20 percent and eight percent in 2011, 2010 and 2009, respectively, primarily due to expansion in
Africa, Asia Pacific, Indian subcontinent, Eastern Europe, Latin America and Western Europe.
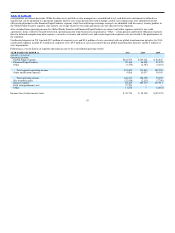
Bill Payment Fee and Other Revenue
Bill payment fee and other revenue decreased 11 percent in 2011, with lower volumes contributing an $11.3 million decline and lower average fees from
changes in industry mix contributing a $2.5 million decline. In 2010, bill payment fee and other revenue decreased six percent, with lower average fees from
changes in industry mix contributing a $5.3 million decline and lower volumes contributing a $2.8 million decline. The impact of changes in industry mix
reflect our continued growth in new emerging verticals that generate lower revenue per transaction than our traditional verticals. Due to economic
conditions in the United States, volumes in our traditional verticals, such as auto and mortgage, continue to be negatively impacted. Bill payment transaction
volume decreased seven percent and one percent in 2011 and 2010, respectively.
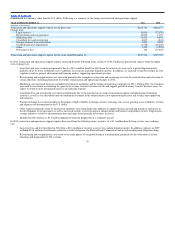
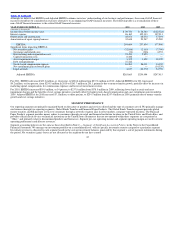
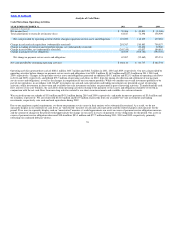
Global Funds Transfer Commissions Expense
YEAR ENDED DECEMBER 31, 2011 2010
(Amounts in thousands)
Global Funds Transfer commissions expense for the prior year $496,645 $488,116
Change from:
Money Transfer volume growth 43,046 23,662
Euro exchange rate 7,941 (7,406)
Money transfer commission rates 452 (1,240)
Signing bonuses 3,644 (3,874)
Bill payment volumes (6,238) (2,946)
Bill payment commission rates 164 368
Other 34 (35)
Global Funds Transfer commissions expense for the year ended December 31 $545,688 $496,645
Commissions expense consists primarily of fees paid to our third−party agents for money transfer and bill payment services, as well as the amortization of
capitalized agent signing bonuses. In 2011, signing bonus expense increased due to new agent signings. In 2010, signing bonus expense decreased as certain
historical signing bonuses were fully amortized or written off in the prior year.
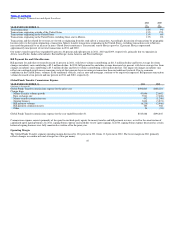
Operating Margin
The Global Funds Transfer segment operating margin decreased to 10.8 percent in 2011 from 13.2 percent in 2010. The lower margin in 2011 primarily
reflects changes in corridor mix and average face value per money
45